
Average Directional Index (ADX)
What is it?
What it measures:
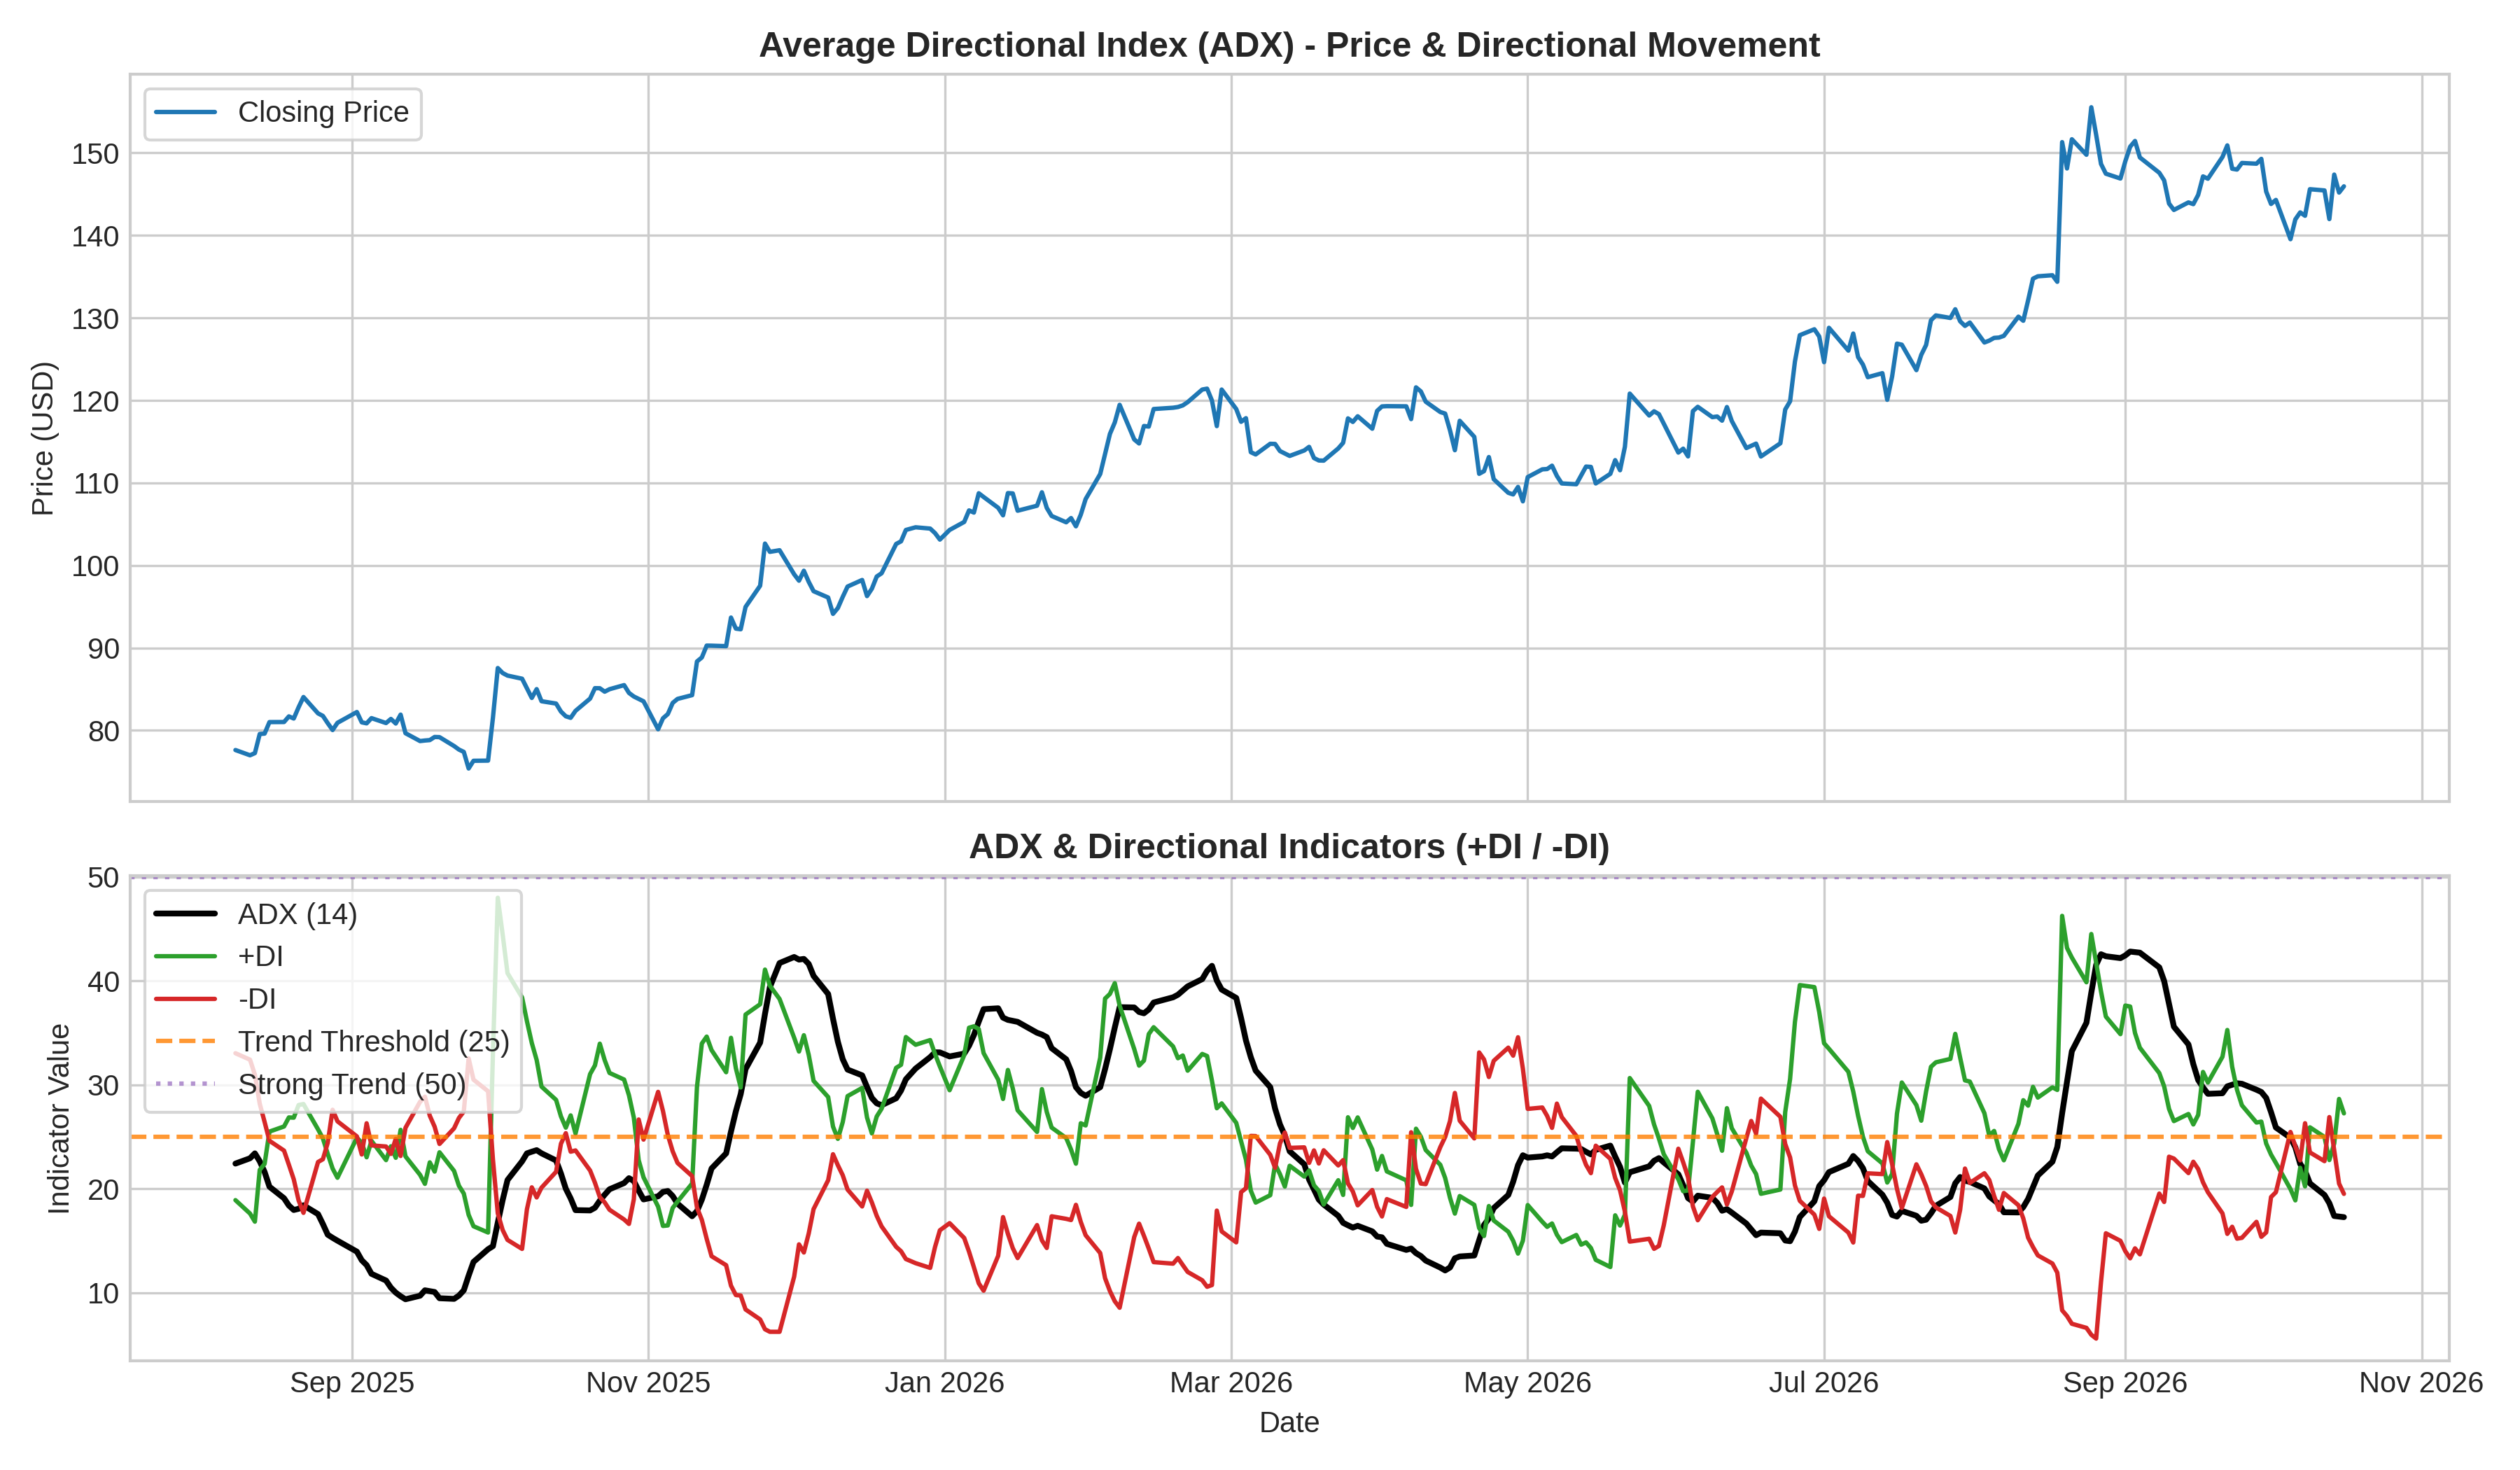
The Average Directional Index (ADX) quantifies trend strength without regard to trend direction. It is calculated alongside Positive Directional Indicator (+DI) and Negative Directional Indicator (-DI) to measure both trend velocity and orientation.
How to interpret it:
- Trend Strength Baseline (ADX > 25): An ADX reading above 25 indicates a strong, well-defined trend regime, while readings below 20 signal a weak or ranging market.
- Directional Bias (+DI vs -DI): When +DI is above -DI, upside price movement dominates. When -DI is above +DI, downside price movement dominates.
- Directional Crossovers: +DI crossing above -DI with ADX rising above 25 confirms a high-conviction bullish trend entry.
Used for:
- Filtering trade signals to execute trend-following strategies only when ADX > 25.
- Preventing false breakout trades during non-trending or consolidation regimes.
Limitations:
- Non-Directional Nature: ADX line rising indicates a strengthening trend regardless of whether price is surging upward or crashing downward.
- Smoothed Lag: Because ADX uses double-smoothed moving averages of directional movement, it lags fast, V-shaped price reversals.