
Triple Exponential Moving Average (TEMA)
What is it?
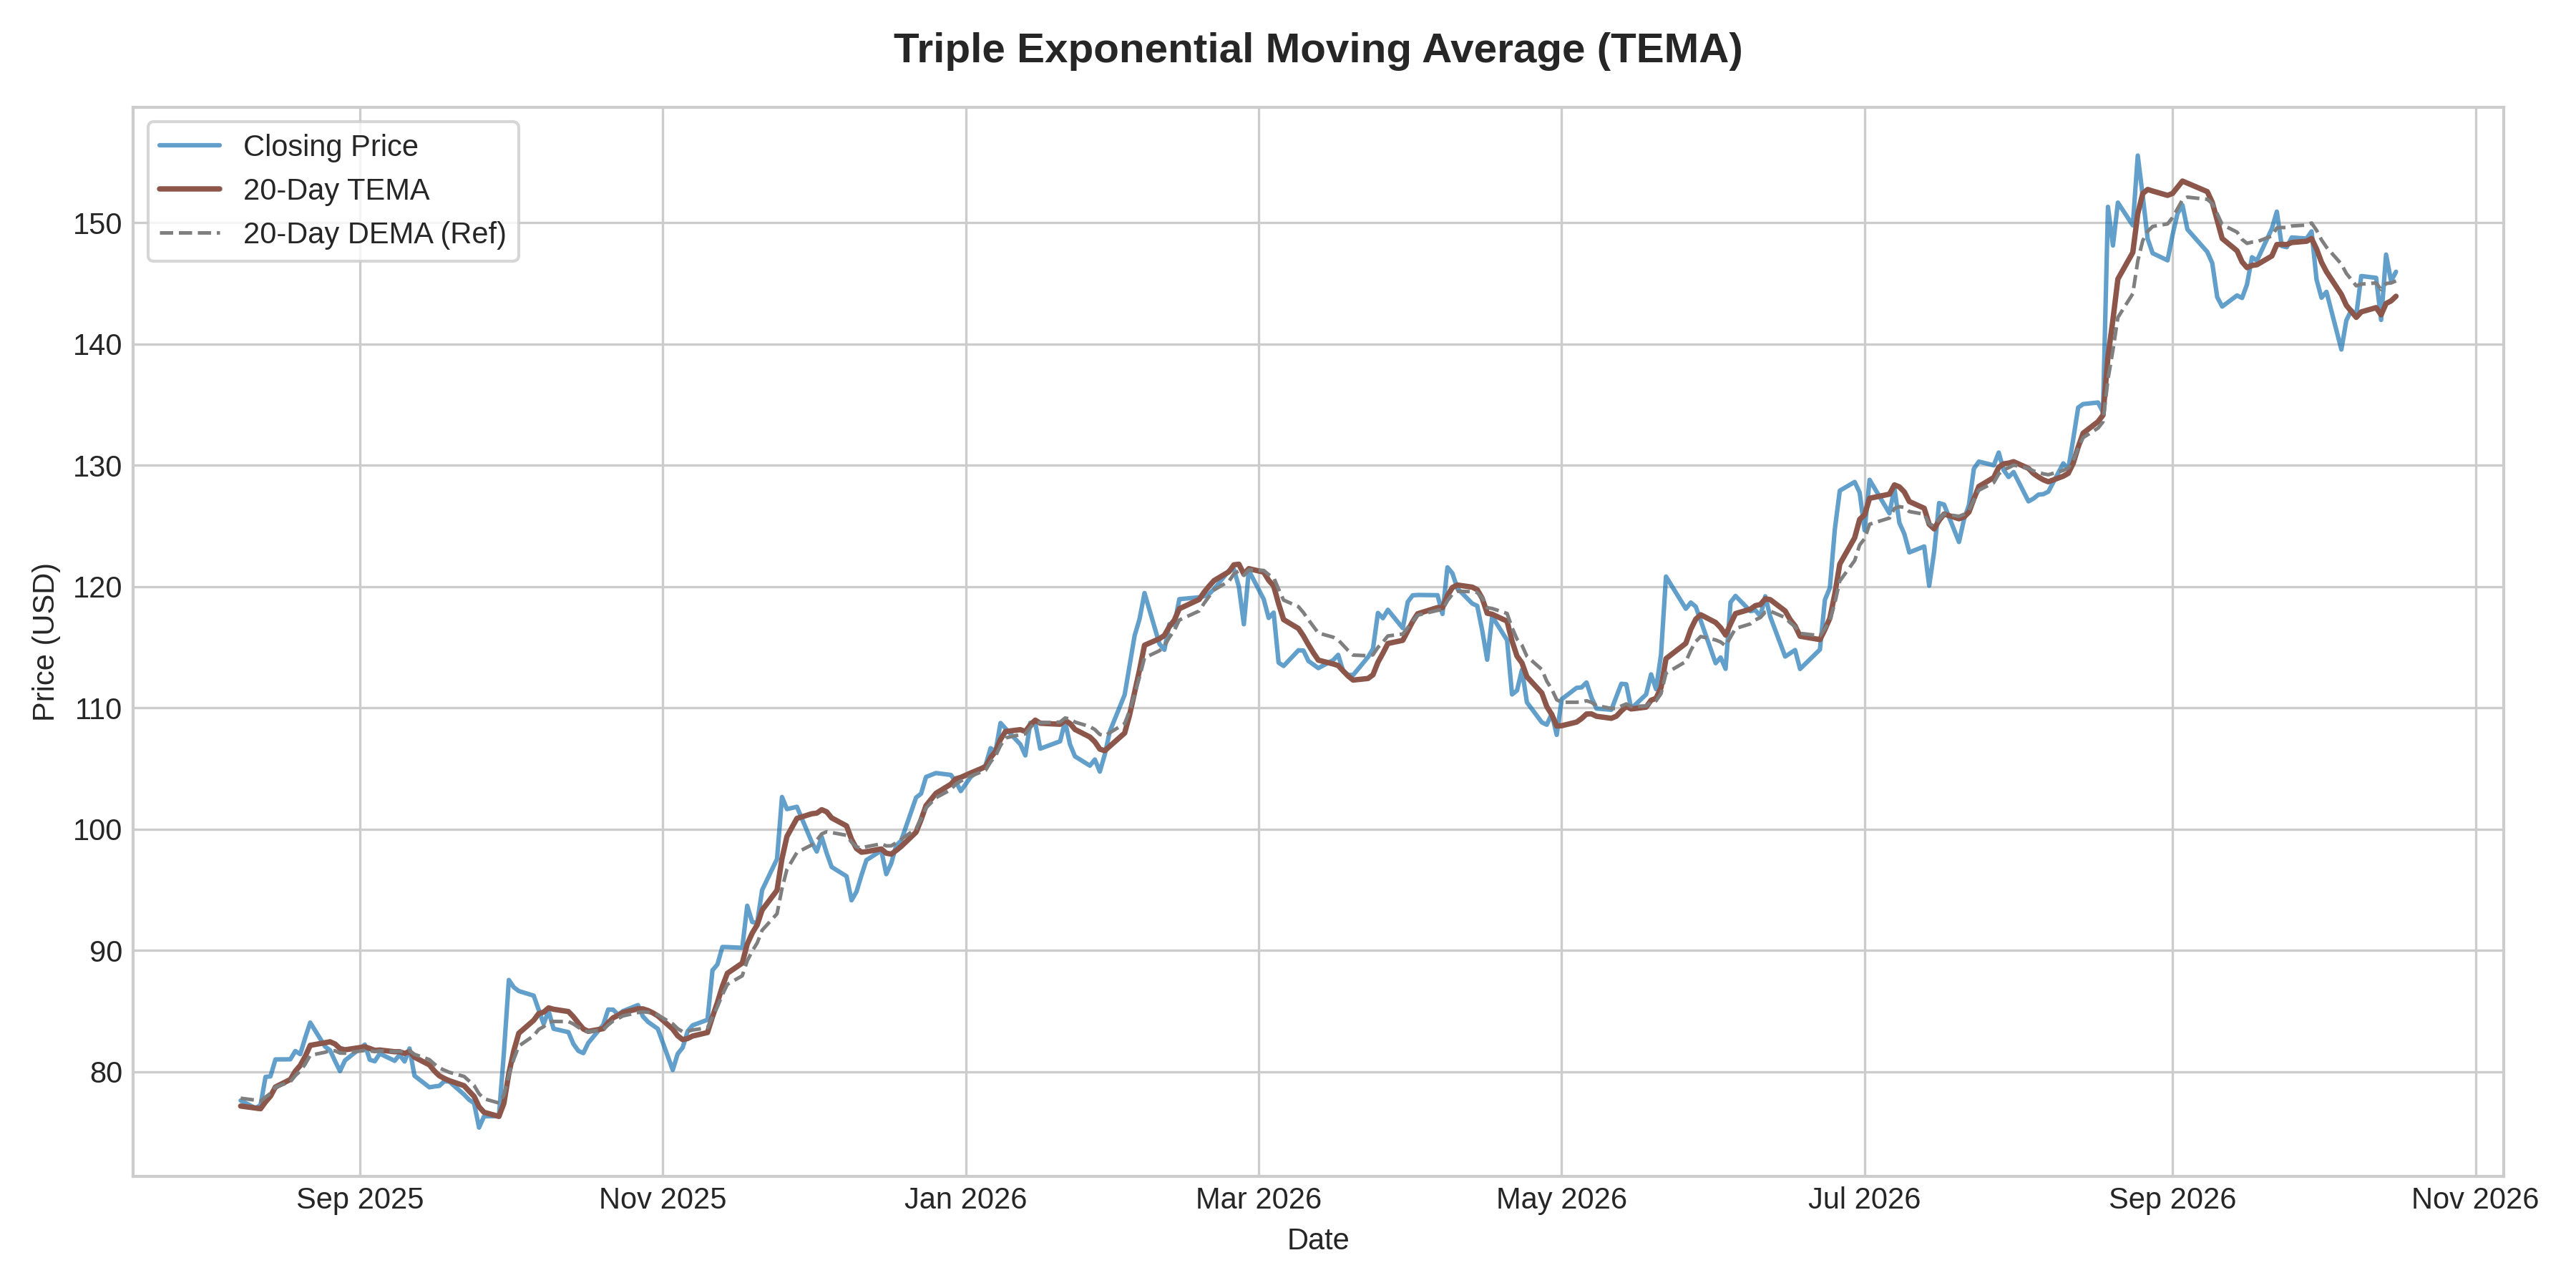
What it measures:
TEMA applies triple exponential smoothing (3 * EMA - 3 * EMA(EMA) + EMA(EMA(EMA))) to eliminate almost all lag while keeping the moving average line smooth.
How to interpret it:
- Zero-Lag Tracking: Hugs strong trends tighter than SMA, EMA, or DEMA.
- Slope Changes: A inflection in TEMA's slope provides immediate warning of trend exhaustion.
Used for:
- High-frequency trade setups and momentum confirmation.
- Trailing stop-loss placement in fast-moving market trends.
Limitations:
- Extremely prone to false crossover signals when market price moves sideways.
- Requires pairing with secondary trend-strength indicators like ADX.