
Simple Moving Average (SMA)
What is it?
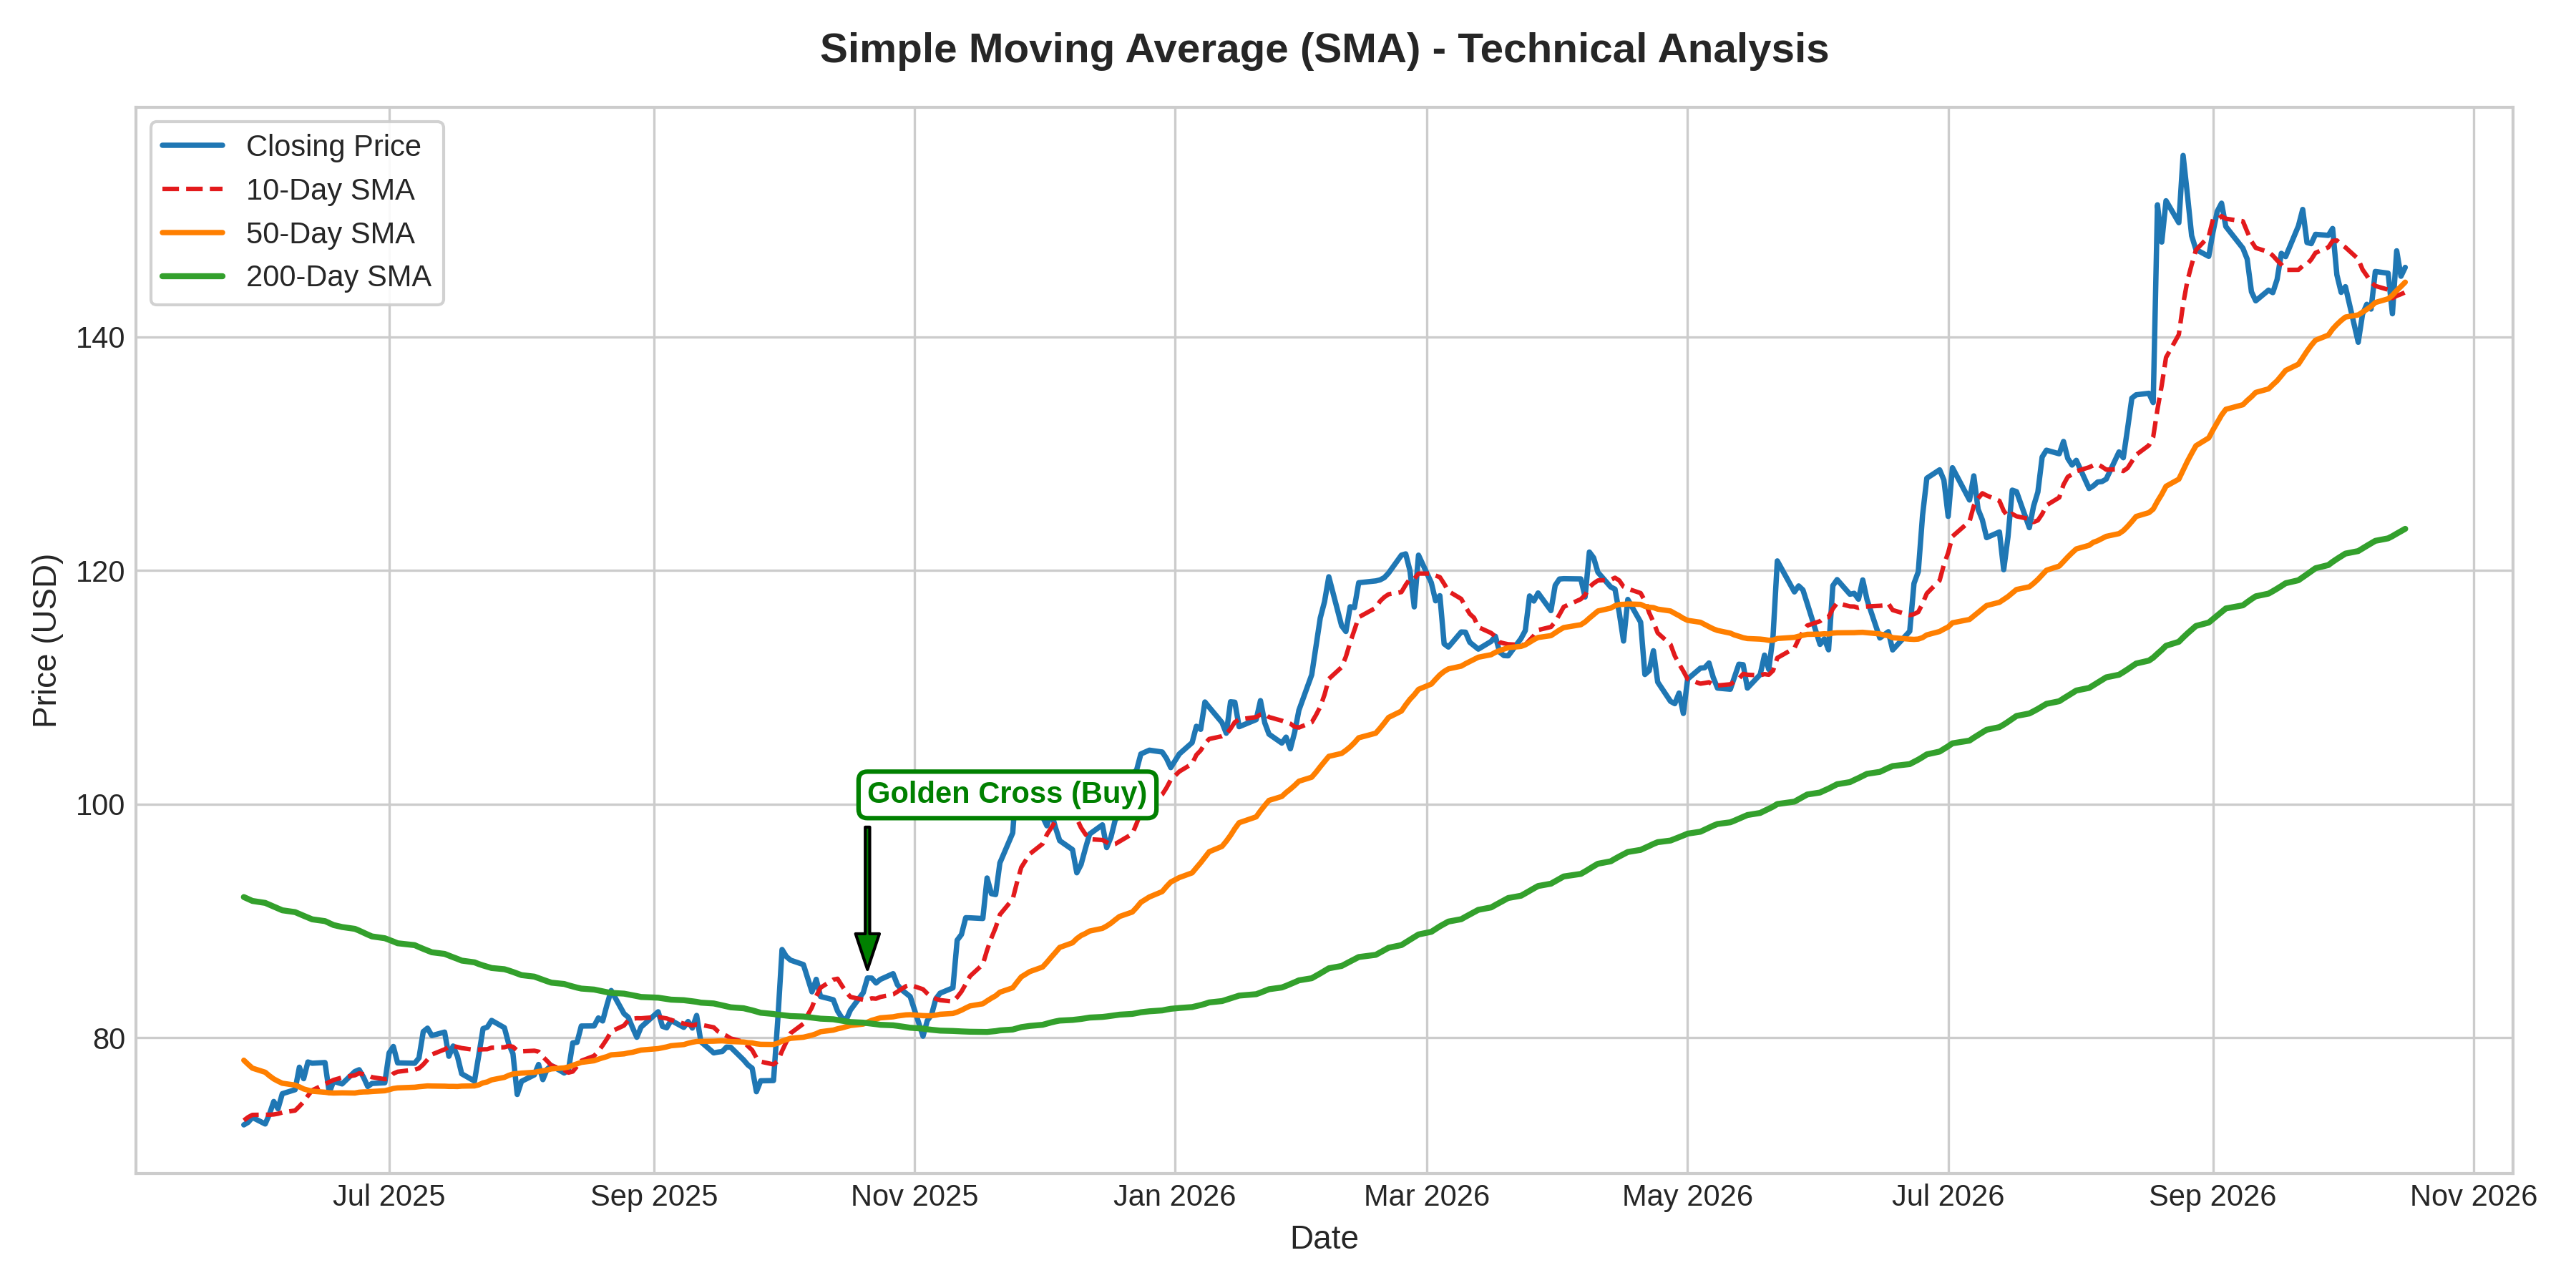
What it measures:
The Simple Moving Average (SMA) calculates the unweighted average price of an asset over a specific number of period bars. By continuously updating the average price as new periods close, it smooths out short-term market noise and exposes the underlying price trend.
How to interpret it:
- Trend Direction: An upward-sloping SMA indicates a bullish trend, while a downward-sloping SMA signals a bearish trend.
- Price Crossovers: Price crossing above an SMA signals dynamic bullish momentum; crossing below signals selling pressure.
- Moving Average Crossovers: A shorter-term SMA crossing above a longer-term SMA (e.g., 50-day over 200-day) forms a Golden Cross (Buy signal). Conversely, crossing below forms a Death Cross (Sell signal).
Used for:
- Identifying macro and micro market trends.
- Establishing dynamic support and resistance zones.
- Generating trend-following trade entry and exit triggers.
Limitations:
- Lagging Indicator: Because SMA gives equal weight to all historical data points in the period, it responds slowly to sudden structural price shifts.
- Whipsaws in Ranging Markets: During sideways or low-volatility consolidation, price often crosses back and forth across the SMA, generating false crossover signals.