
Chaikin Money Flow (CMF)
What is it?
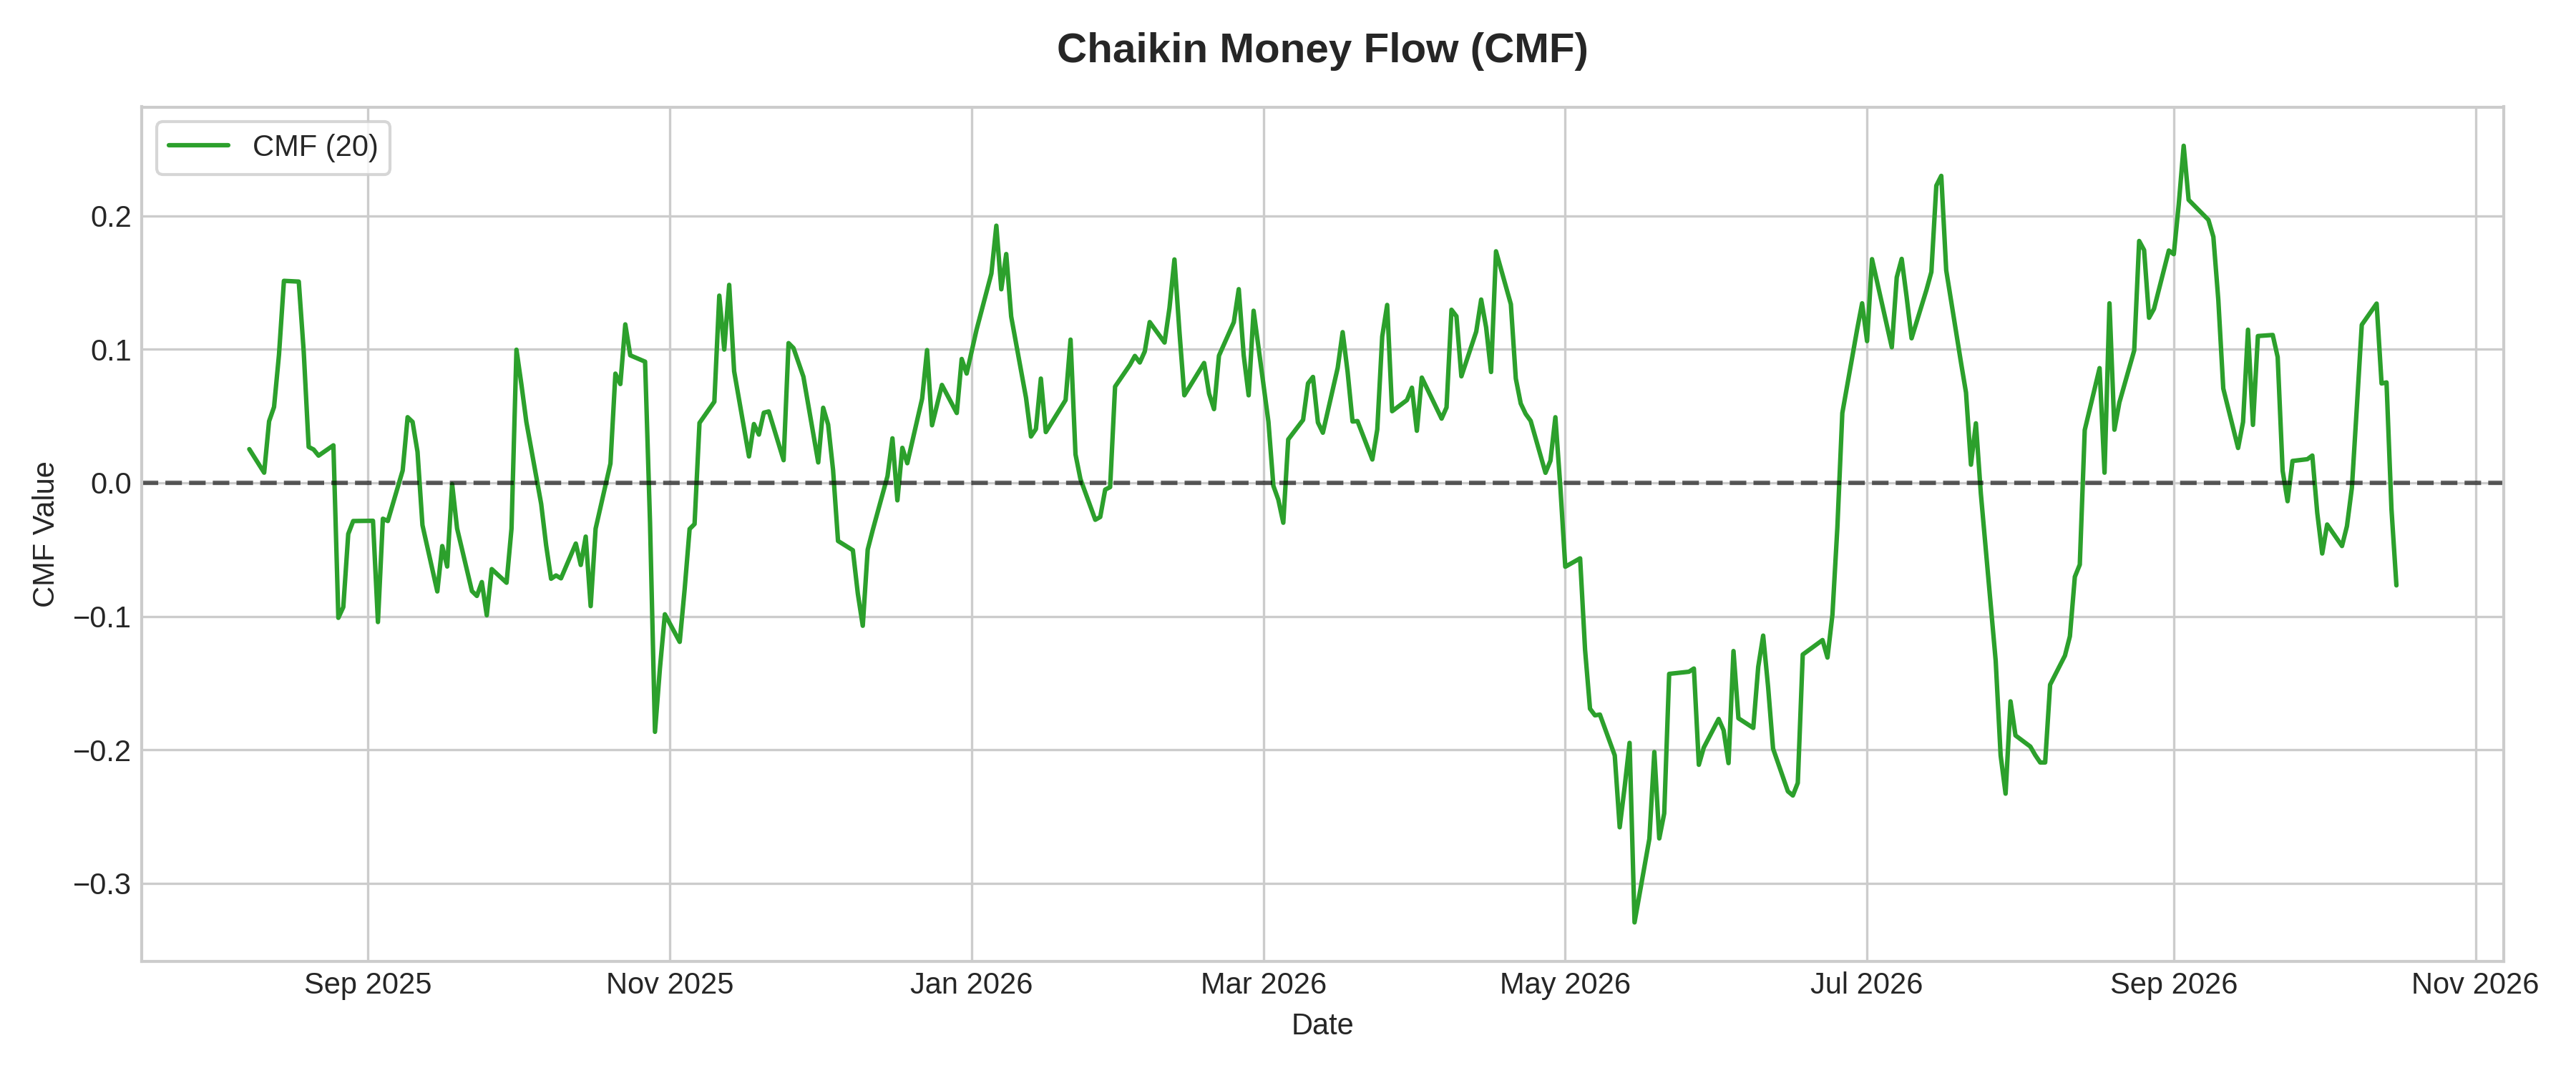
What it measures:
Measures the amount of Money Flow Volume over a specific period (typically 20 days) to assess buying and selling pressure.
How to interpret it:
- CMF Above +0.05: Indicates buying pressure and accumulation.
- CMF Below -0.05: Indicates selling pressure and distribution.
Used for:
- Gauging institutional buying or selling pressure within trend moves.
Limitations:
- Does not account for price gaps occurring between trading sessions.