
Supertrend Indicator
What is it?
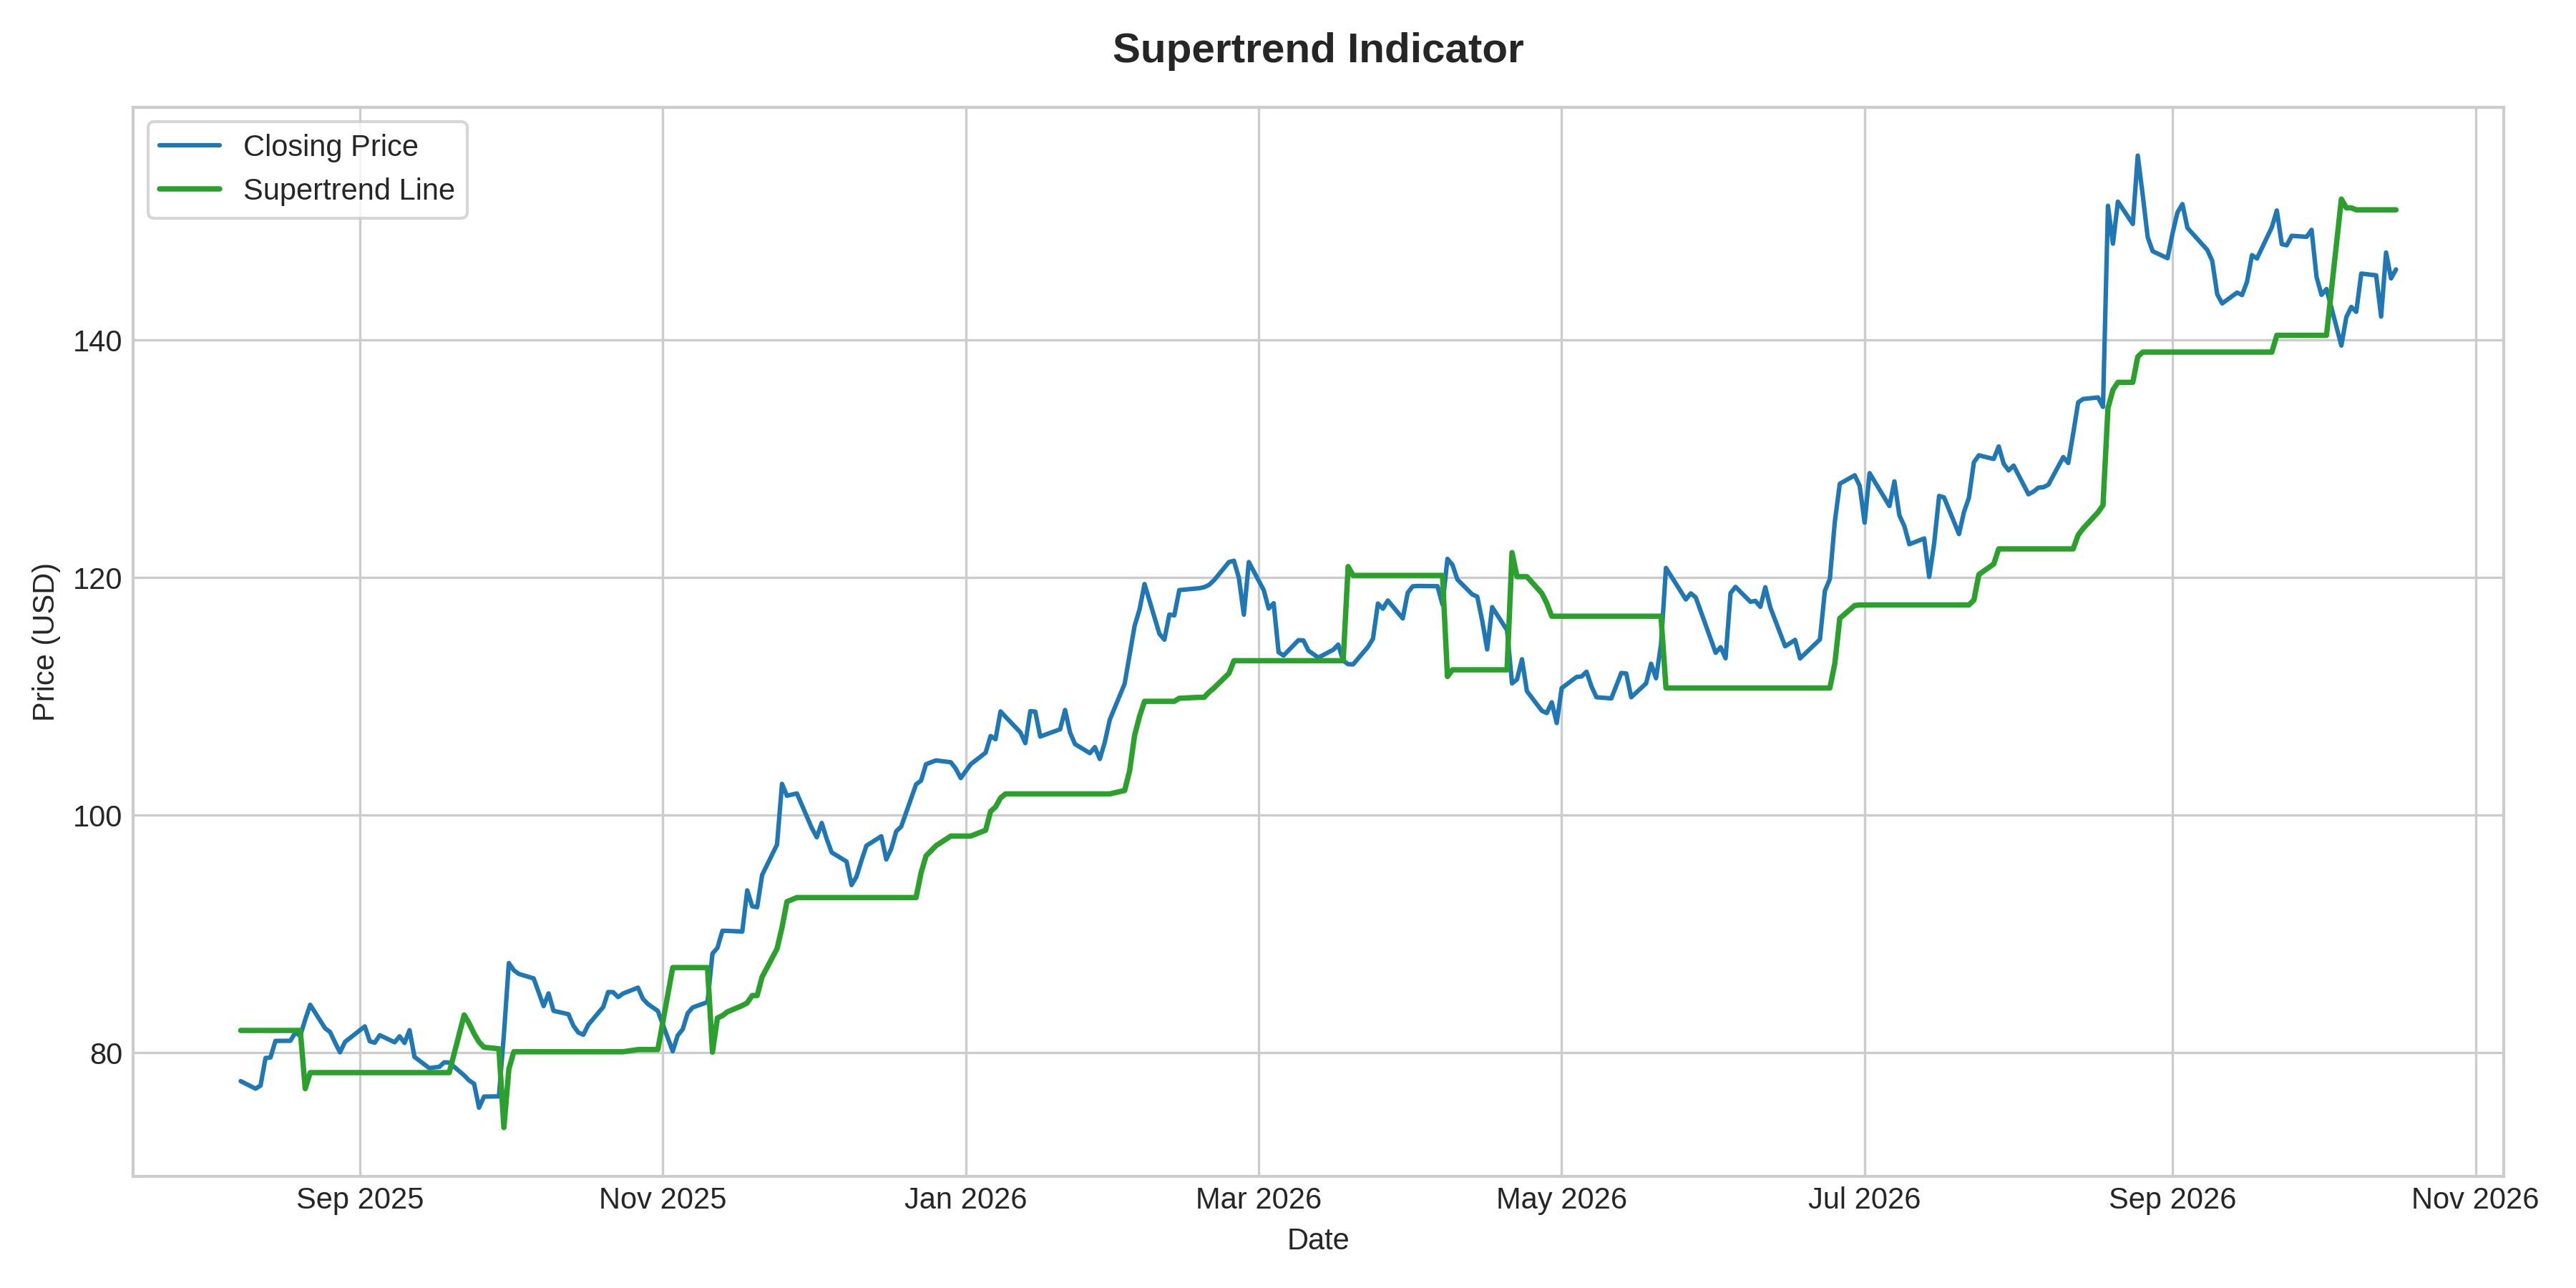
What it measures:
Supertrend tracks overall trend direction using Average True Range (ATR) multipliers to adjust dynamic support and resistance levels around market price action.
How to interpret it:
- Trend Line Position: Supertrend line positioned below price indicates an uptrend (Buy); line positioned above price indicates a downtrend (Sell).
- Flip Signals: The exact bar where Supertrend switches sides marks a trend flip event.
Used for:
- Trend-following trade entry triggers.
- Dynamic trailing stop-loss execution.
Limitations:
- Generates frequent whipsaws during tight ranging or low-volatility periods.
- Does not predict trend tops or bottoms; acts strictly as a lagging trend-following system.