
Return Transformations (Log, Pct, Z-Score)
What is it?
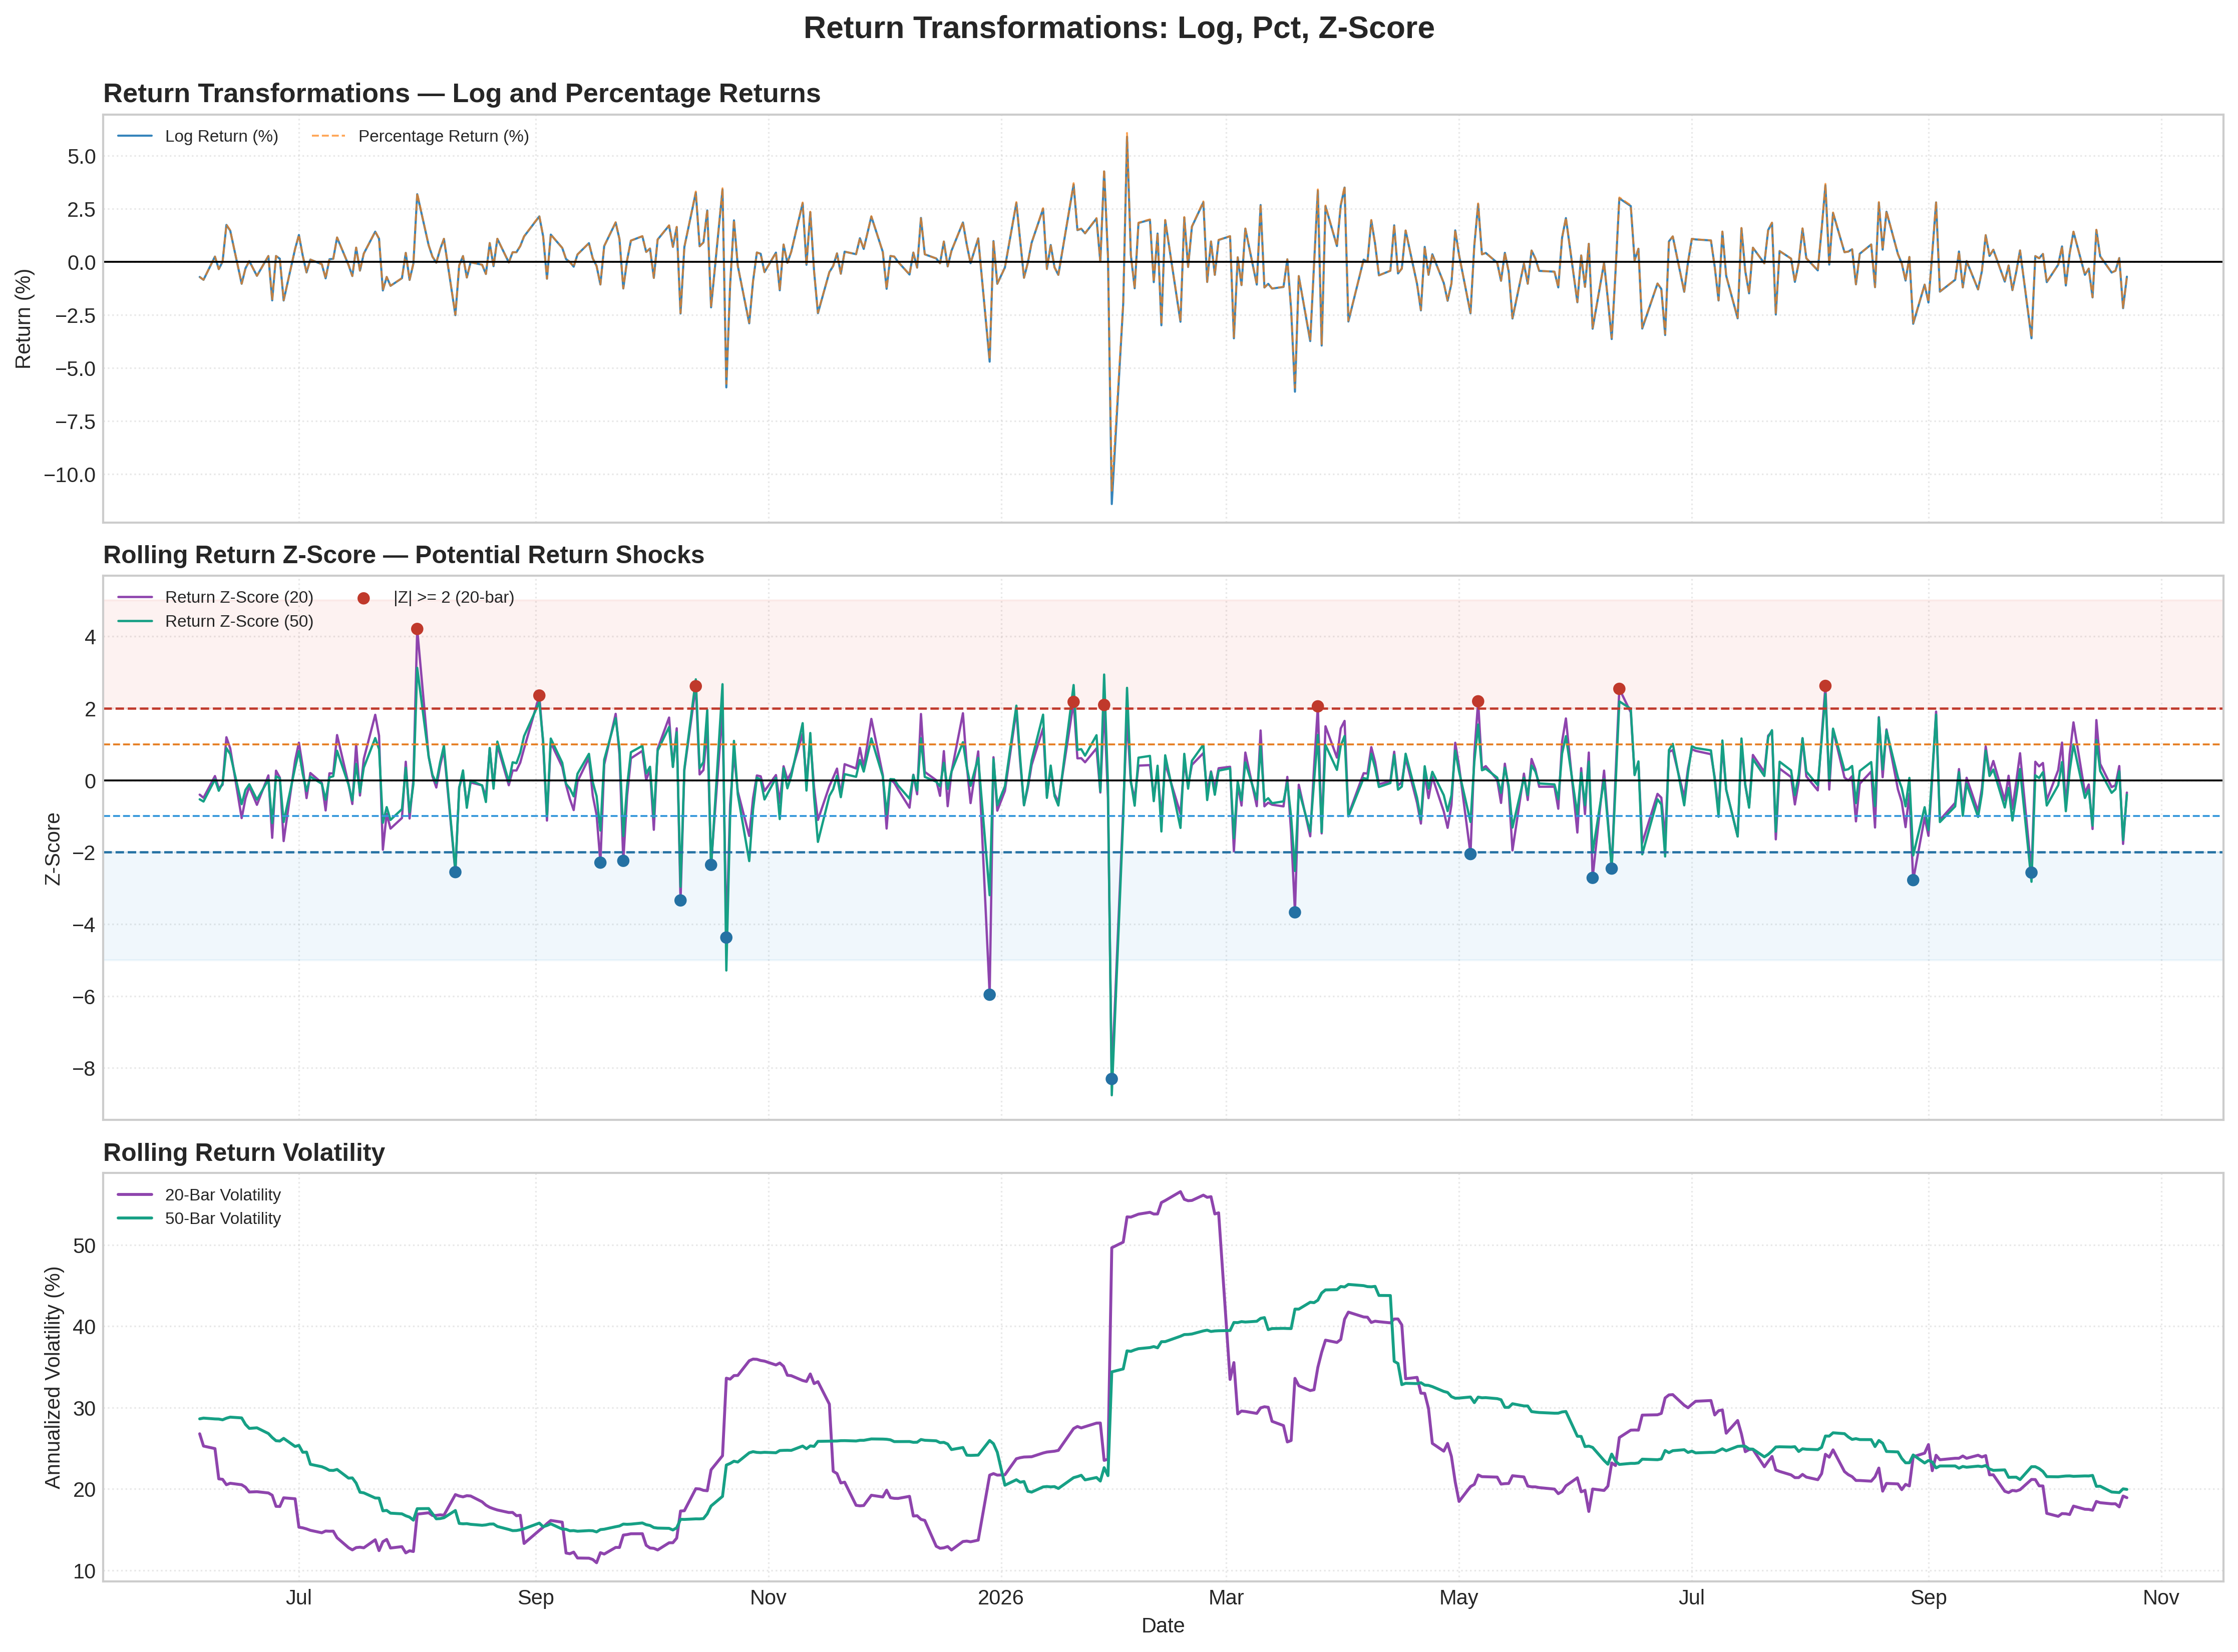
What it measures:
Measures period-over-period price changes using logarithmic returns and percentage returns. Standardizes log returns using rolling Z-Scores to identify unusually large positive or negative movements relative to the preceding return distribution. Rolling volatility measures changes in return variability over time.
How to interpret it:
- Return Z-Score > +2.0: Indicates an unusually large positive return relative to the preceding rolling window.
- Return Z-Score < -2.0: Indicates an unusually large negative return relative to the preceding rolling window.
- Z-Score Near Zero: Indicates a return close to its recent rolling mean.
- Increasing Rolling Volatility: Signals greater return variability and potentially elevated market risk.
- Clusters of Extreme Z-Scores: May indicate persistent market stress, a volatility-regime shift, or consecutive large price moves.
- Log Returns vs. Percentage Returns: Usually move closely together but diverge more during large price changes.
- Stationarity: Returns are often more suitable for statistical modeling than raw prices, but stationarity must be tested rather than assumed.
Used for:
- Detecting unusually large positive and negative return shocks.
- Generating quantitative trading signals from standardized return deviations.
- Identifying volatility-regime changes and periods of elevated risk.
- Creating normalized return features for machine-learning models.
- Supporting risk management, anomaly detection, and dynamic position-sizing strategies.
Limitations:
- A Z-Score outside ±2.0 does not automatically establish statistical significance or imply a BUY/SELL signal; financial returns may exhibit fat tails and non-normal distributions.
- Extreme Z-Scores can cluster during volatility-regime shifts, reducing the reliability of fixed thresholds.
- Rolling means and standard deviations are sensitive to lookback window selection and changing market conditions.
- Log returns and percentage returns are related but not identical, particularly during large price movements.
- Returns are not necessarily stationary; structural breaks, volatility clustering, and changing distributions can persist.
- Annualized volatility depends on the sampling frequency and annualization assumptions.