
Average True Range (ATR)
What is it?
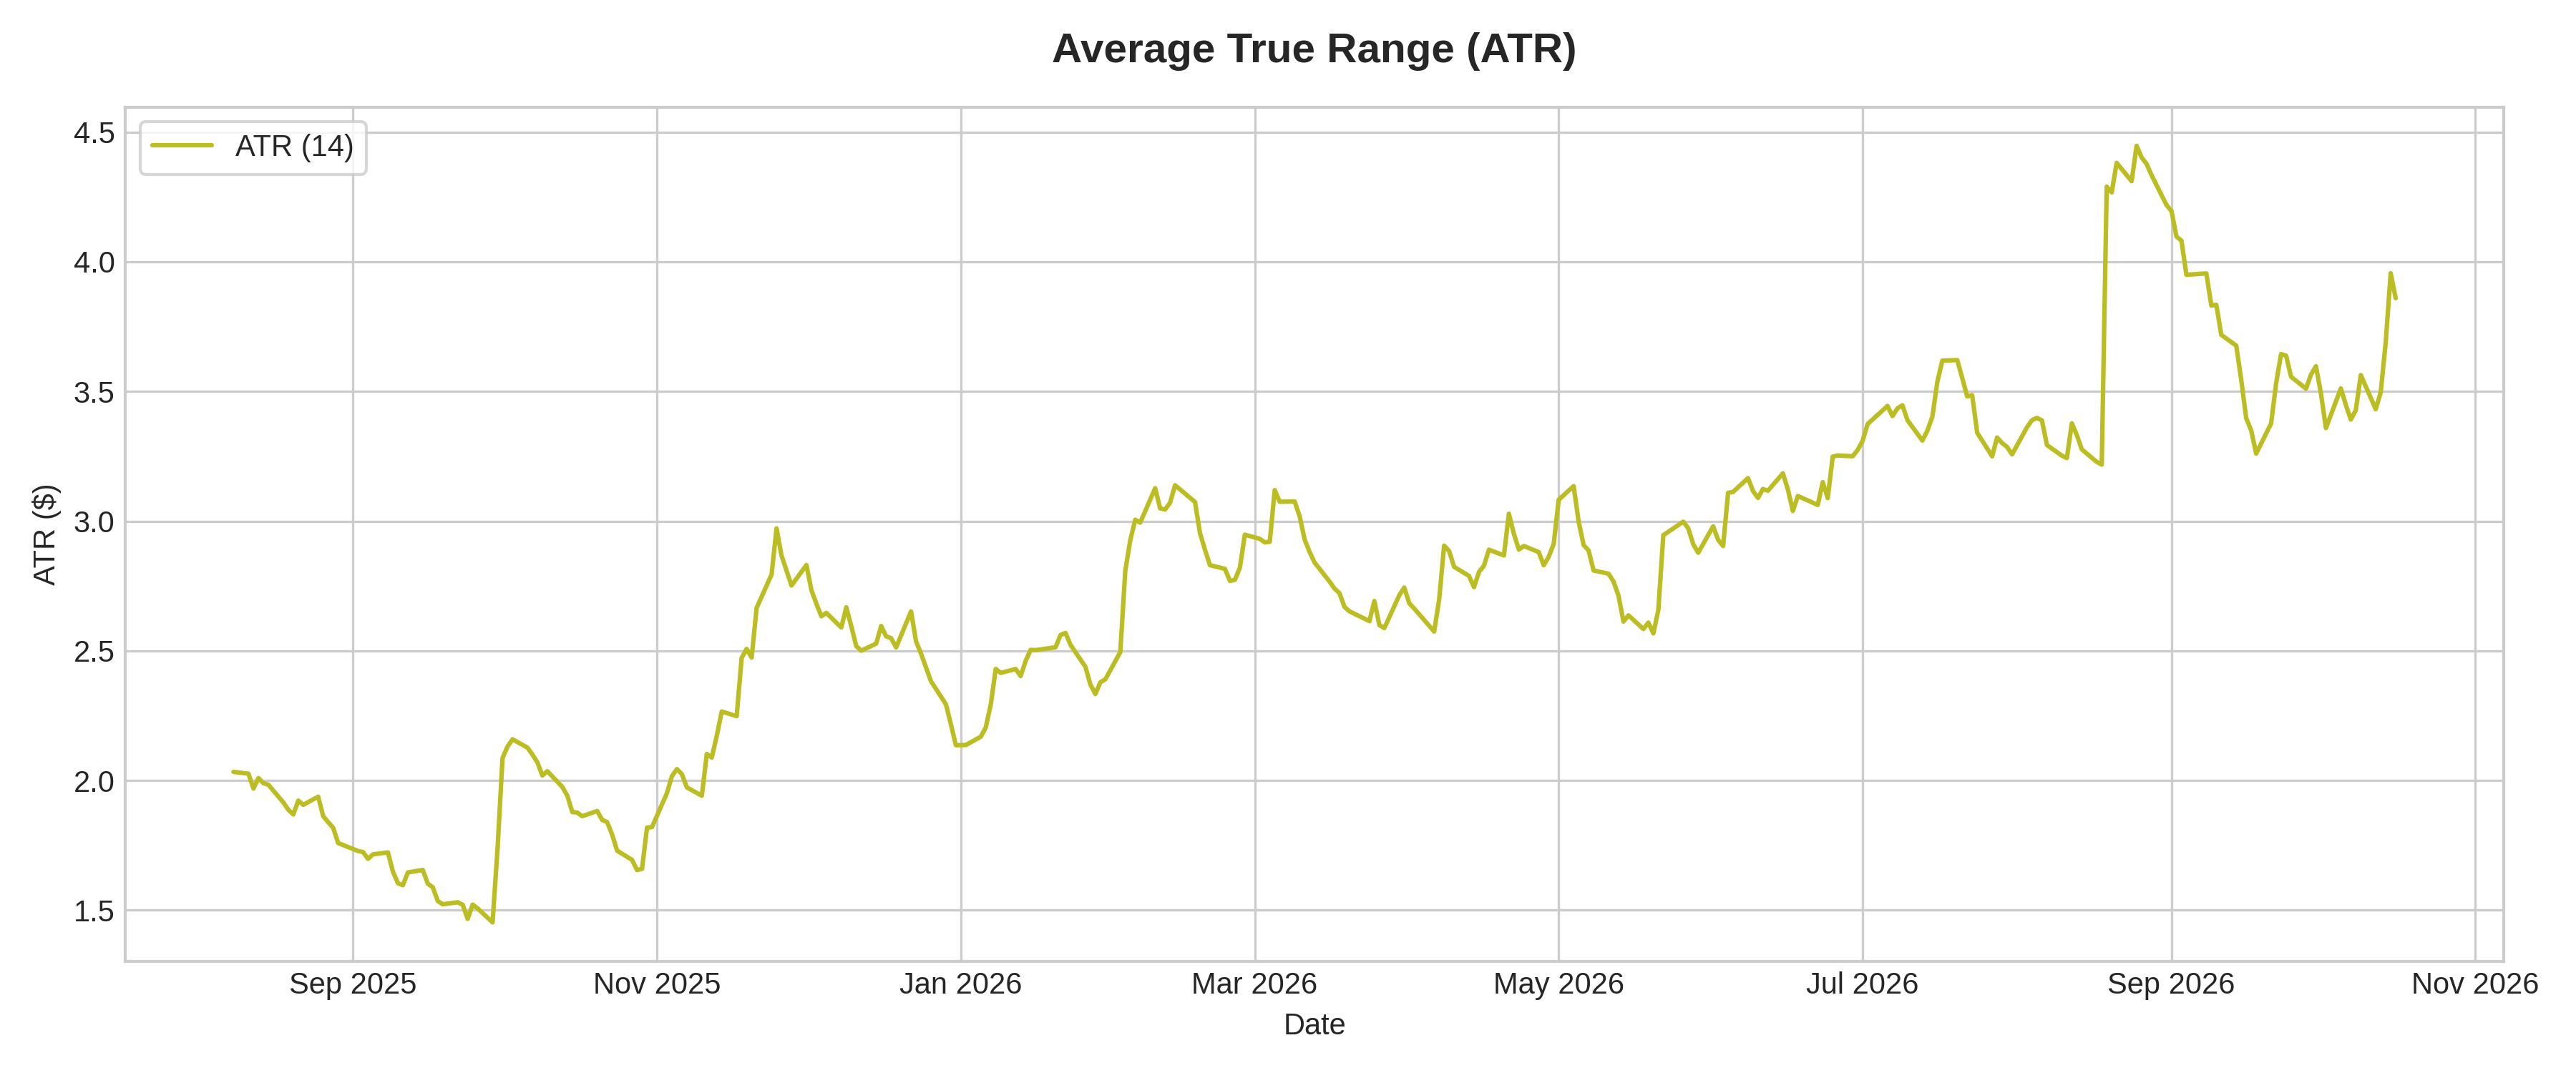
What it measures:
Measures absolute market volatility by decomposing the entire price range of an asset over a specified time period.
How to interpret it:
- Rising ATR: Indicates expanding price volatility regardless of trend direction.
- Falling ATR: Reflects consolidation or low-volatility drift.
Used for:
- Position sizing, volatility filtering, and setting ATR-based stop loss levels.
Limitations:
- Indicates volatility level only; does not provide trend direction info.