
Double Exponential Moving Average (DEMA)
What is it?
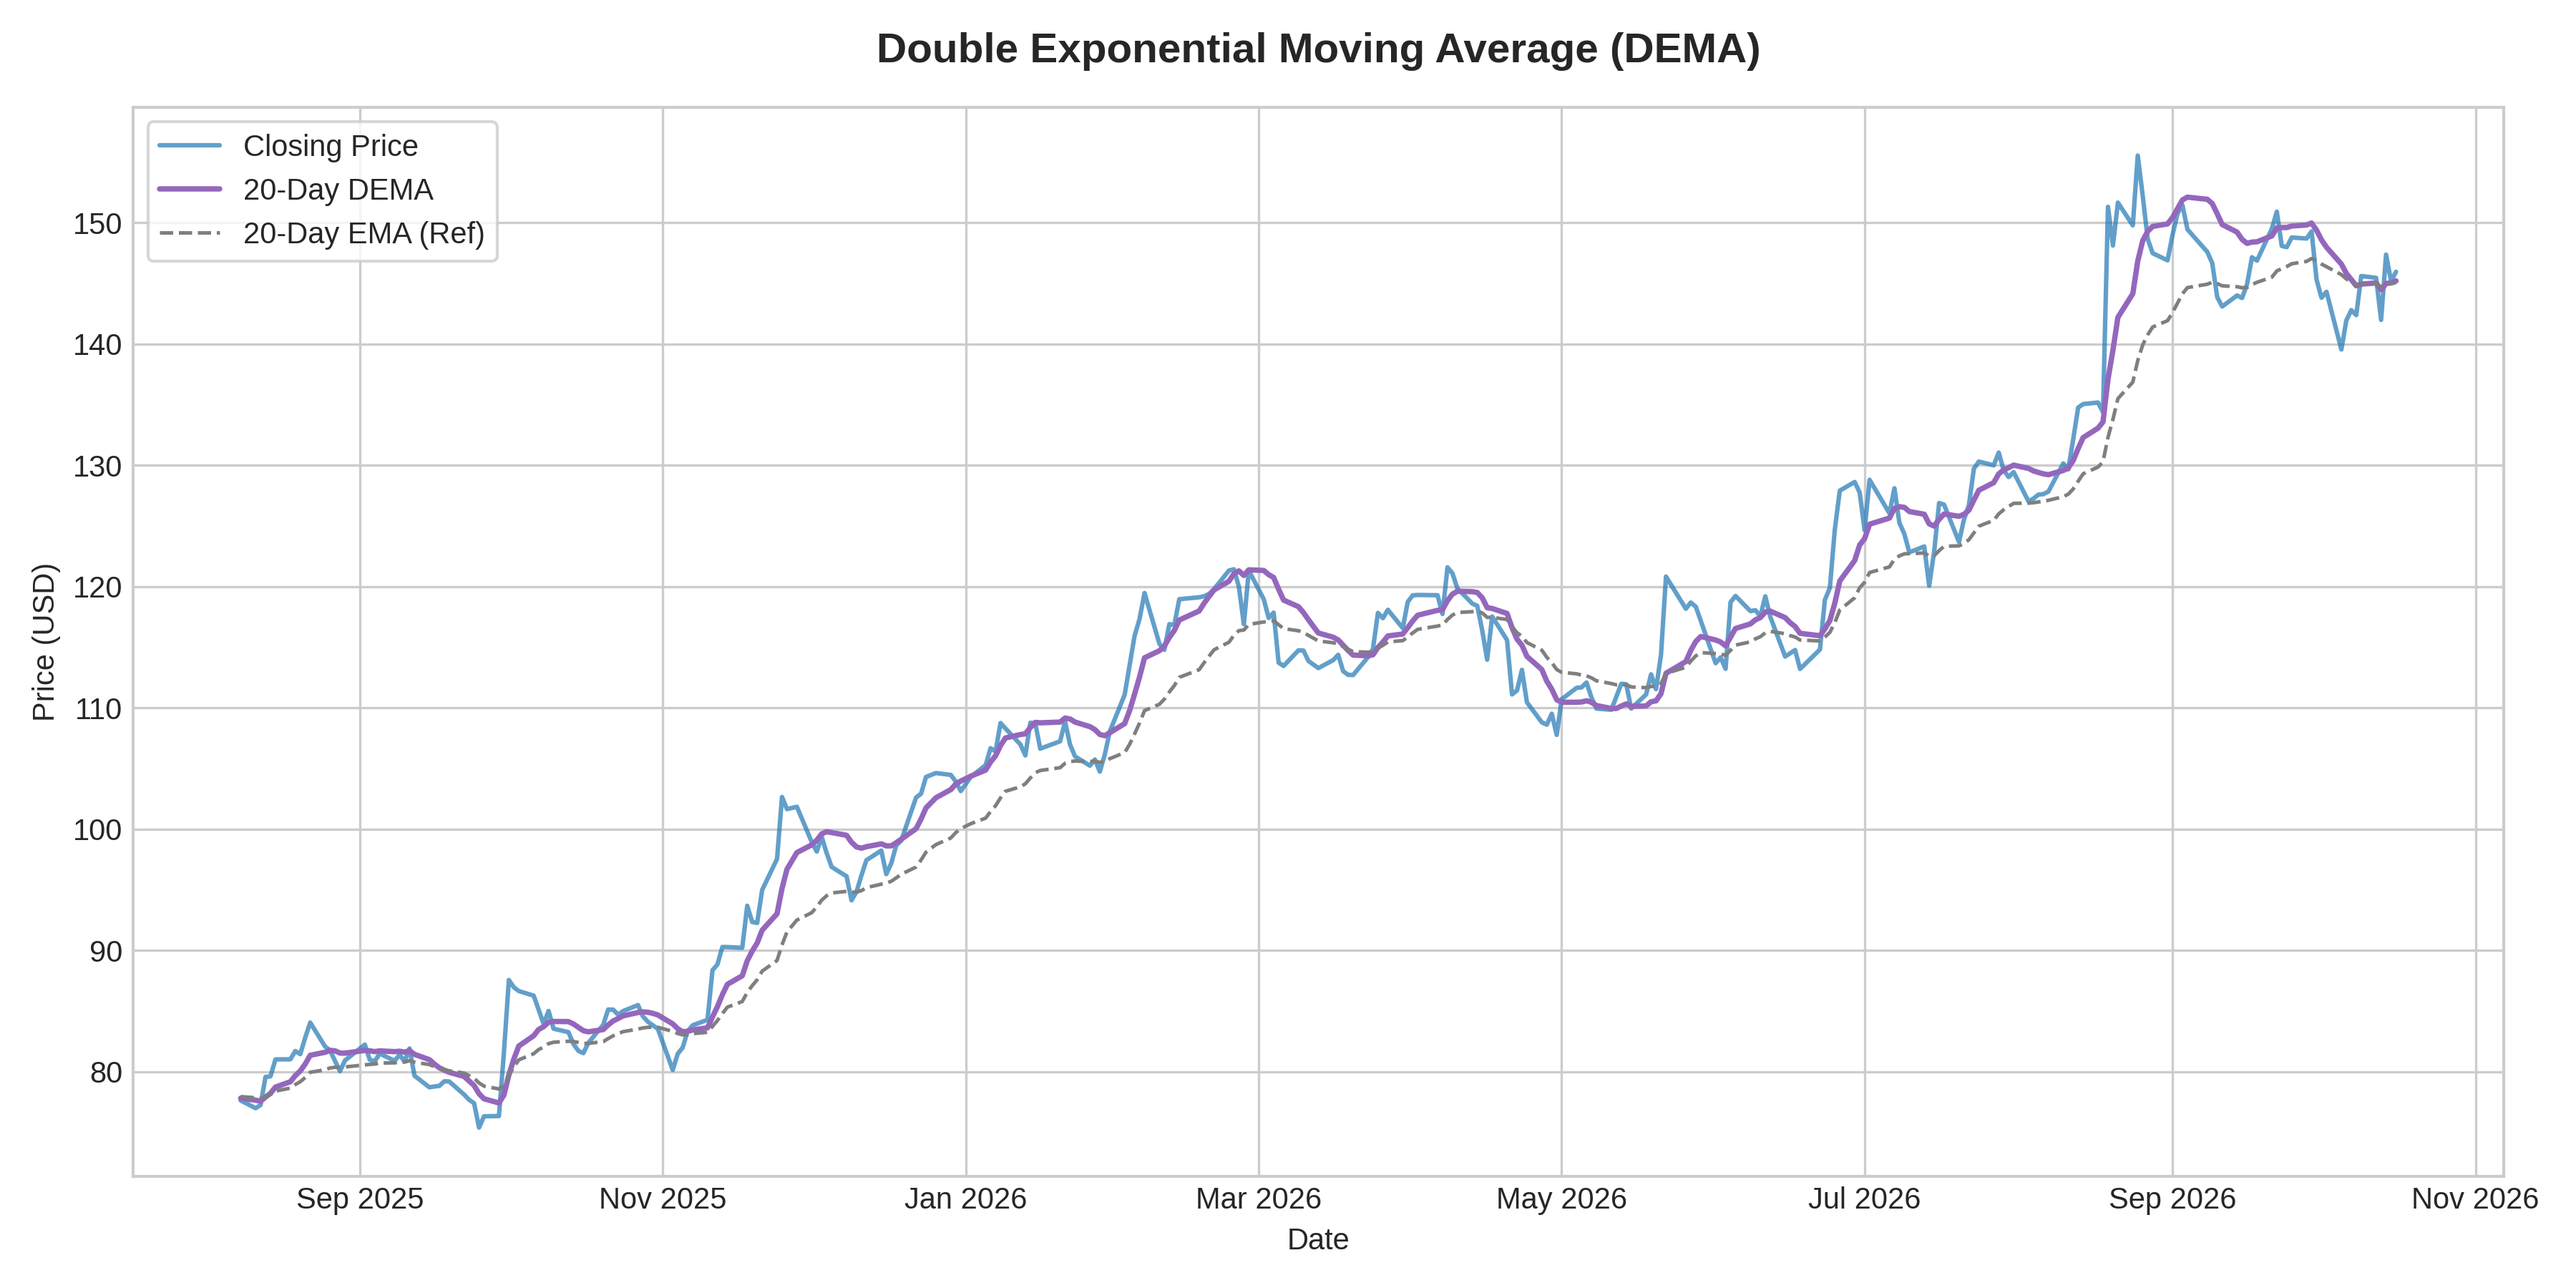
What it measures:
DEMA reduces lag by combining a single EMA and a double-smoothed EMA formula (2 * EMA - EMA(EMA)). It provides a much faster-reacting trend line than traditional moving averages.
How to interpret it:
- Ultra-Fast Response: Curves closely around real-time price action while filtering out short-term noise.
- Trend Reversals: Price crossing DEMA serves as an early signal for momentum shifts.
- Crossovers: Short-period DEMA crossing above long-period DEMA generates fast buy triggers.
Used for:
- Day trading and fast-paced swing trading entry signals.
- Reducing lag in volatile or fast-trending assets.
Limitations:
- Higher risk of whipsaws during flat, range-bound market regimes.
- Can overshoot price during extreme high-volatility spikes.