
Linear Regression Slope
What is it?
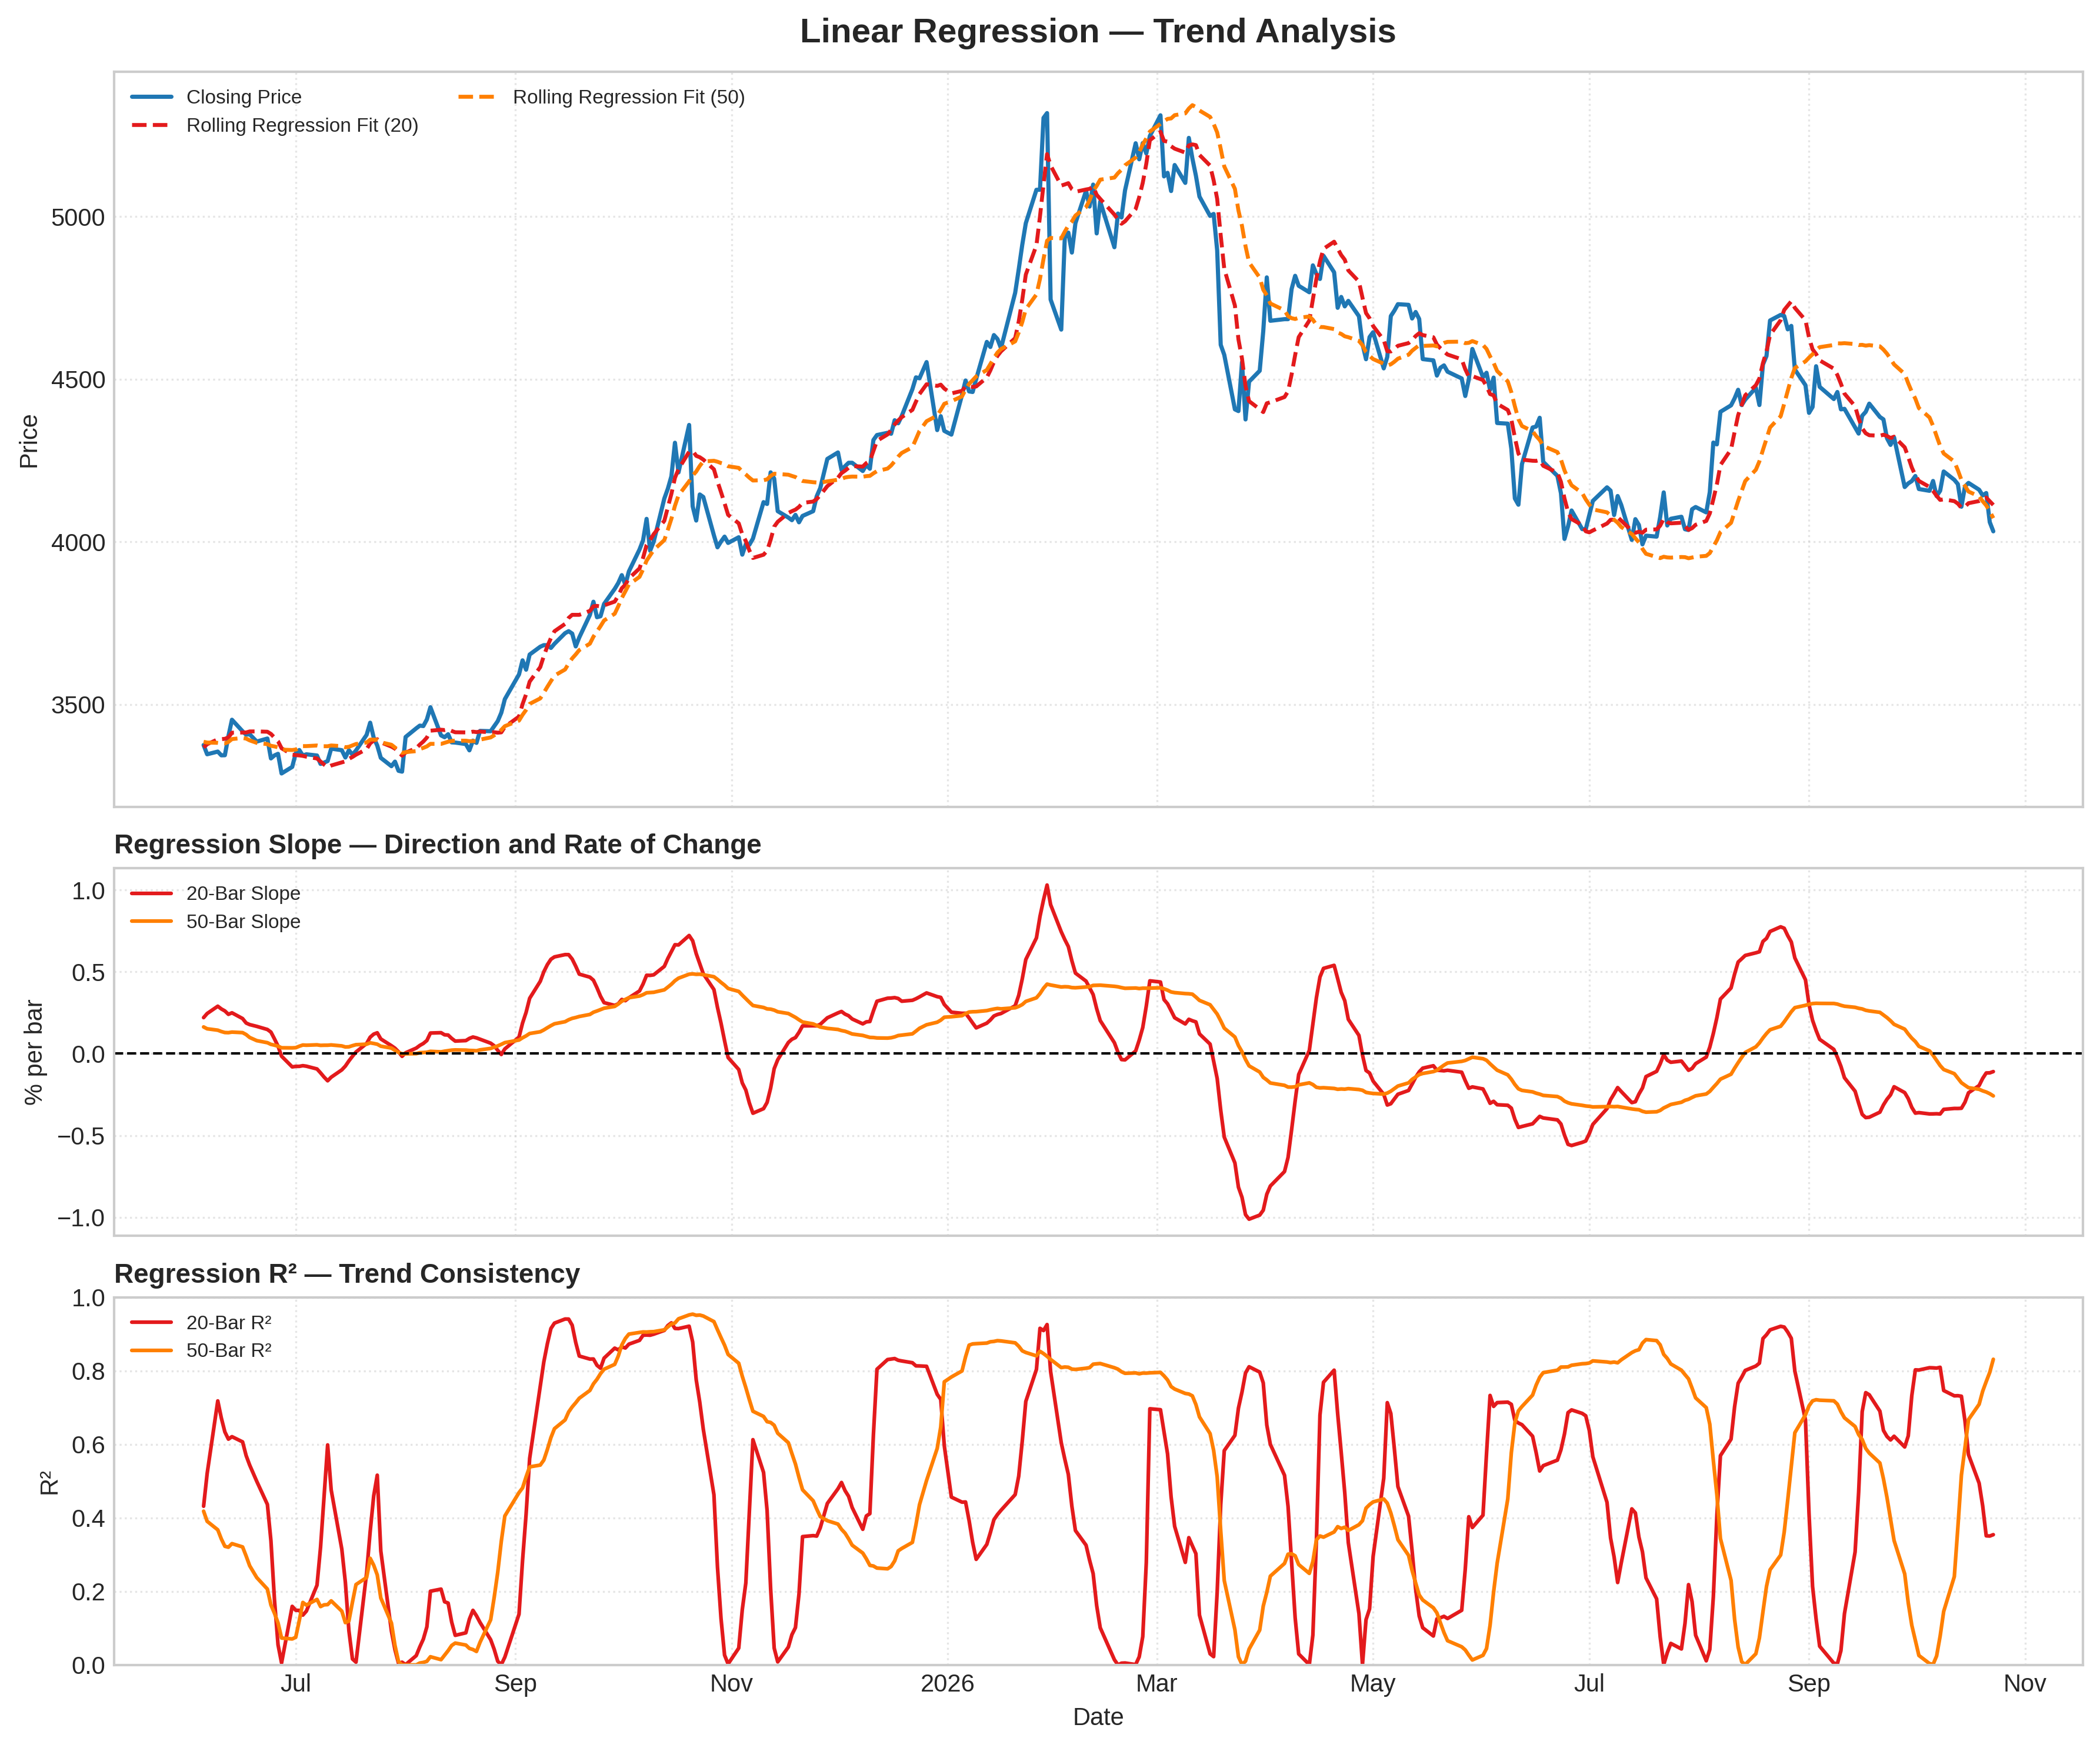
What it measures:
Measures the direction and rate of change of price over a rolling lookback window by fitting a least-squares regression line to historical prices. A normalized log-price slope expresses the fitted trend's approximate percentage change per bar, while the regression R-squared (R²) measures how closely prices follow a linear trend.
How to interpret it:
- Positive Slope: Indicates an upward fitted price trend.
- Negative Slope: Indicates a downward fitted price trend.
- Slope Near Zero: Indicates limited linear directional movement over the selected window, potentially reflecting consolidation or choppy price action.
- Increasing Positive Slope: Suggests the upward trend is strengthening.
- Positive but Declining Slope: Suggests the upward trend may be losing momentum, although the trend remains positive.
- Negative but Rising Slope: Suggests the downward trend may be weakening, although the trend remains negative.
- Increasingly Negative Slope: Suggests the downward trend is strengthening.
- High R²: Indicates that the fitted linear trend explains a large proportion of price variation within the window; it does not guarantee future trend continuation.
- Multi-Window Confirmation: Agreement between short- and longer-window slopes supports directional consistency, while divergence may indicate a transition in trend.
Used for:
- Classifying bullish, bearish, and neutral trend regimes.
- Assessing trend direction and changes in directional strength.
- Detecting potential trend weakening or transition when slope changes sign or its rate of change shifts.
- Confirming SMA/EMA alignment and other trend indicators.
- Combining with ADX, momentum, volatility, and Price Z-Score to distinguish directional trends from potentially extended prices.
- Generating normalized trend features for quantitative trading and machine-learning models.
Limitations:
- The slope describes historical movement within the selected window and does not reliably predict future returns by itself.
- Results depend on the lookback period, price transformation, and normalization method.
- Raw price slopes are not directly comparable across instruments with different price levels; normalized or log-price slopes are generally more suitable for cross-asset comparisons.
- Short lookback windows can be noisy, while longer windows may respond slowly to reversals.
- A linear regression line may poorly represent nonlinear trends, sudden price gaps, or changing market regimes.
- High R² measures historical linear fit, not predictive accuracy or the probability that a trend will continue.
- Slope thresholds for trend classification should be calibrated to the instrument and validated using out-of-sample or walk-forward testing.