
Fibonacci Retracements
What is it?
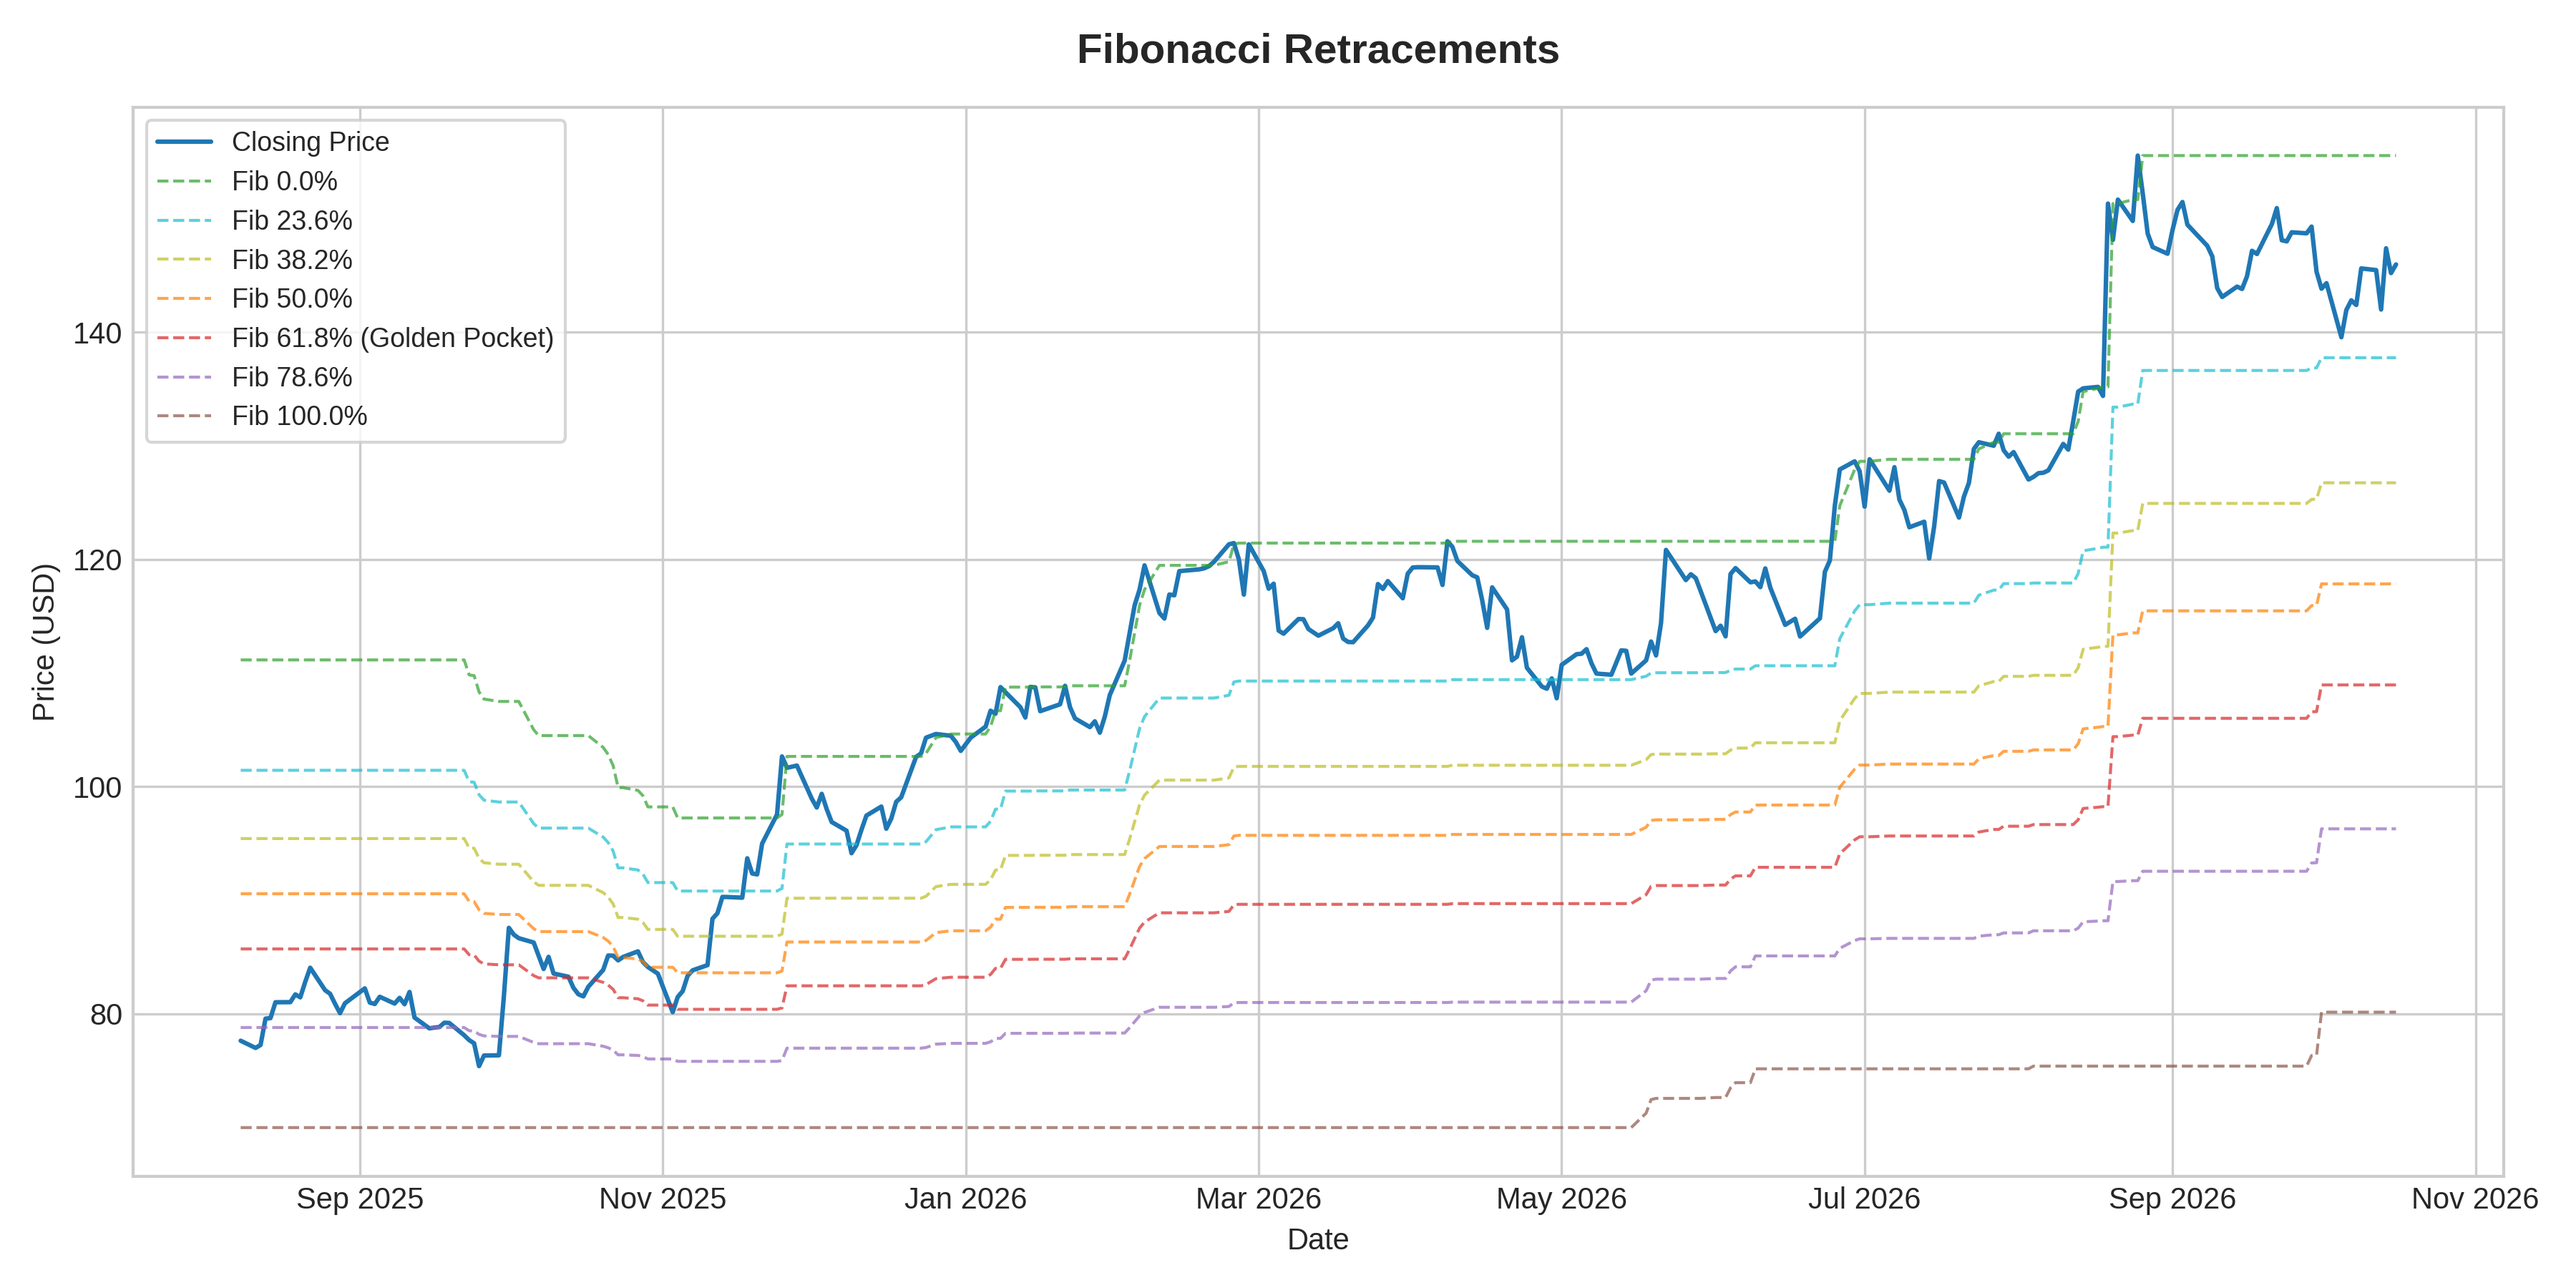
What it measures:
Fibonacci Retracements identify potential support and resistance levels based on mathematical ratios (23.6%, 38.2%, 50.0%, 61.8%, 78.6%) derived from the Golden Ratio sequence.
How to interpret it:
- Golden Pocket (61.8%): The most critical pullback zone where technical trend pullbacks frequently find strong institutional support or resistance.
- Shallow vs Deep Retracements: Strong trends often retrace only to 23.6% or 38.2% before continuing, while deeper consolidations reach 61.8% or 78.6%.
- Confluence: When Fibonacci levels align with key moving averages or pivot lines, the likelihood of a price bounce increases.
Used for:
- Mapping profit target extensions and pullback entry levels.
- Establishing stop-loss levels just below key retracement bounds.
Limitations:
- Subjective anchoring: Results depend on selecting meaningful high and low swing anchor points.
- Price can overshoot retracement levels during high volatility before settling.