
Fibonacci ZigZag Pivots & Market Structure
What is it?
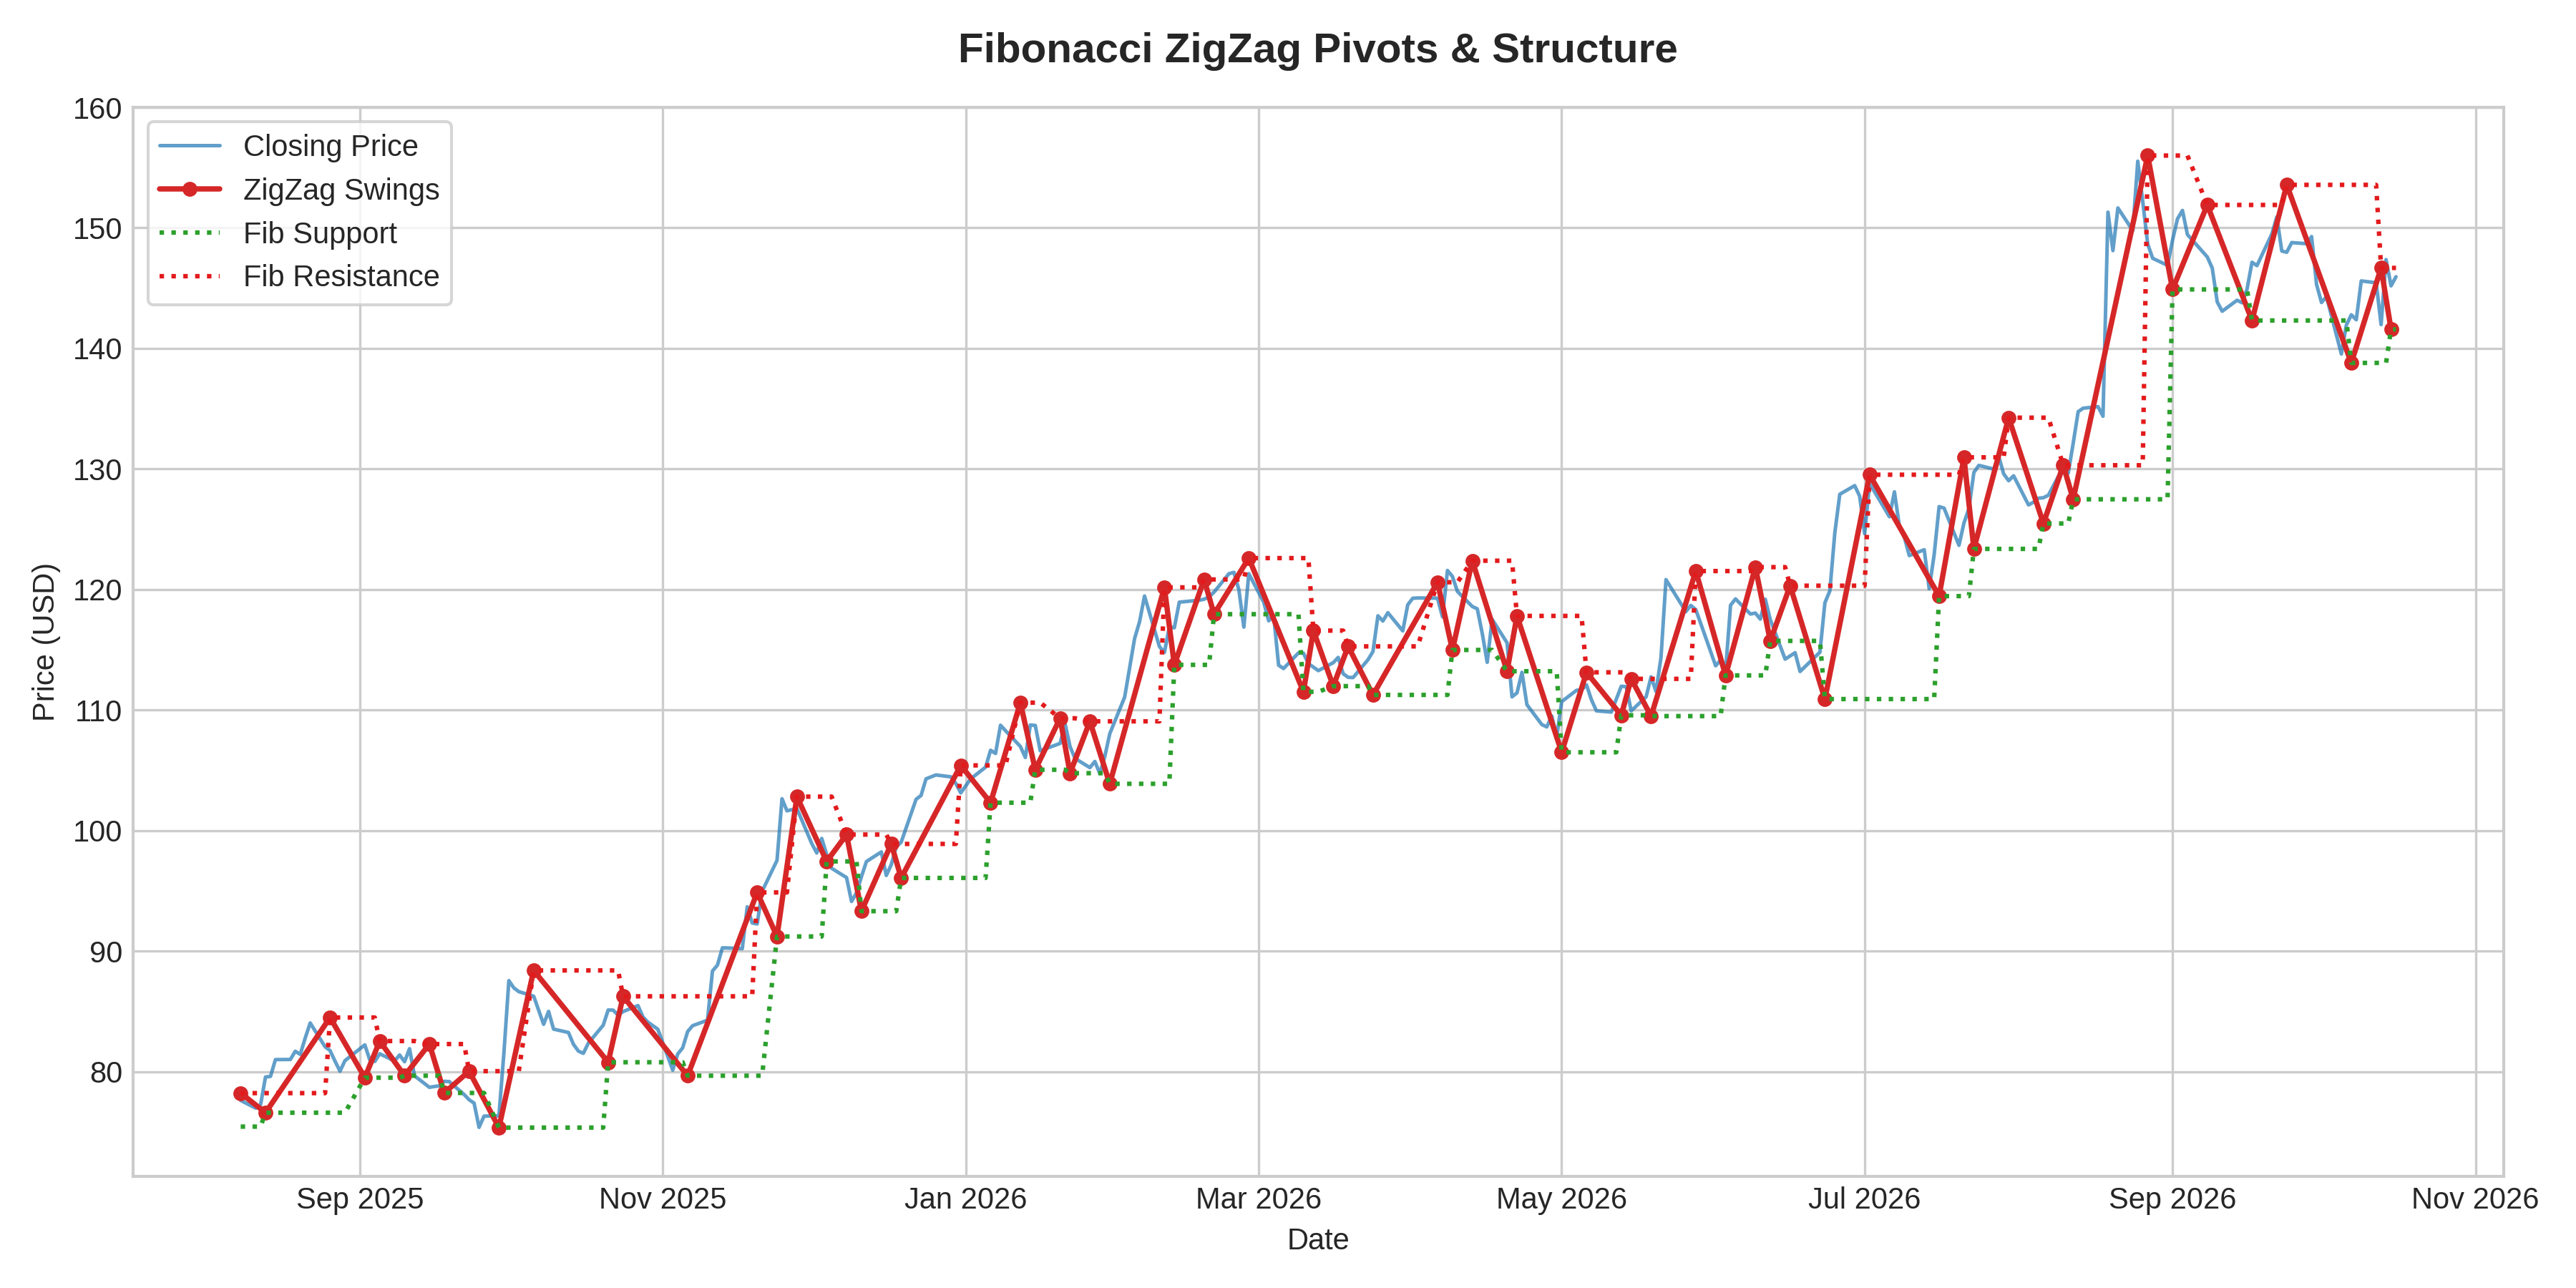
What it measures:
Fibonacci ZigZag filters out noise below a threshold percentage to connect major swing highs and lows, automatically plotting structural support and resistance levels.
How to interpret it:
- Higher Highs / Higher Lows: Ascending ZigZag swing points confirm an active structural uptrend.
- Dynamic Support & Resistance: The horizontal support and resistance lines automatically adjust based on confirmed structural pivot points.
- Rejection Events: Rejections occurring at active ZigZag pivot bounds signal potential reversal setups.
Used for:
- Automating market structure analysis and identifying swing high/low points.
- Calculating dynamic Fib zones relative to validated structural pivots.
Limitations:
- Pivots are confirmed post-hoc once a price threshold is reached, meaning the final ZigZag leg updates dynamically until confirmed.
- Can lag slightly at exact turning points.