
Relative Strength Index (RSI)
What is it?
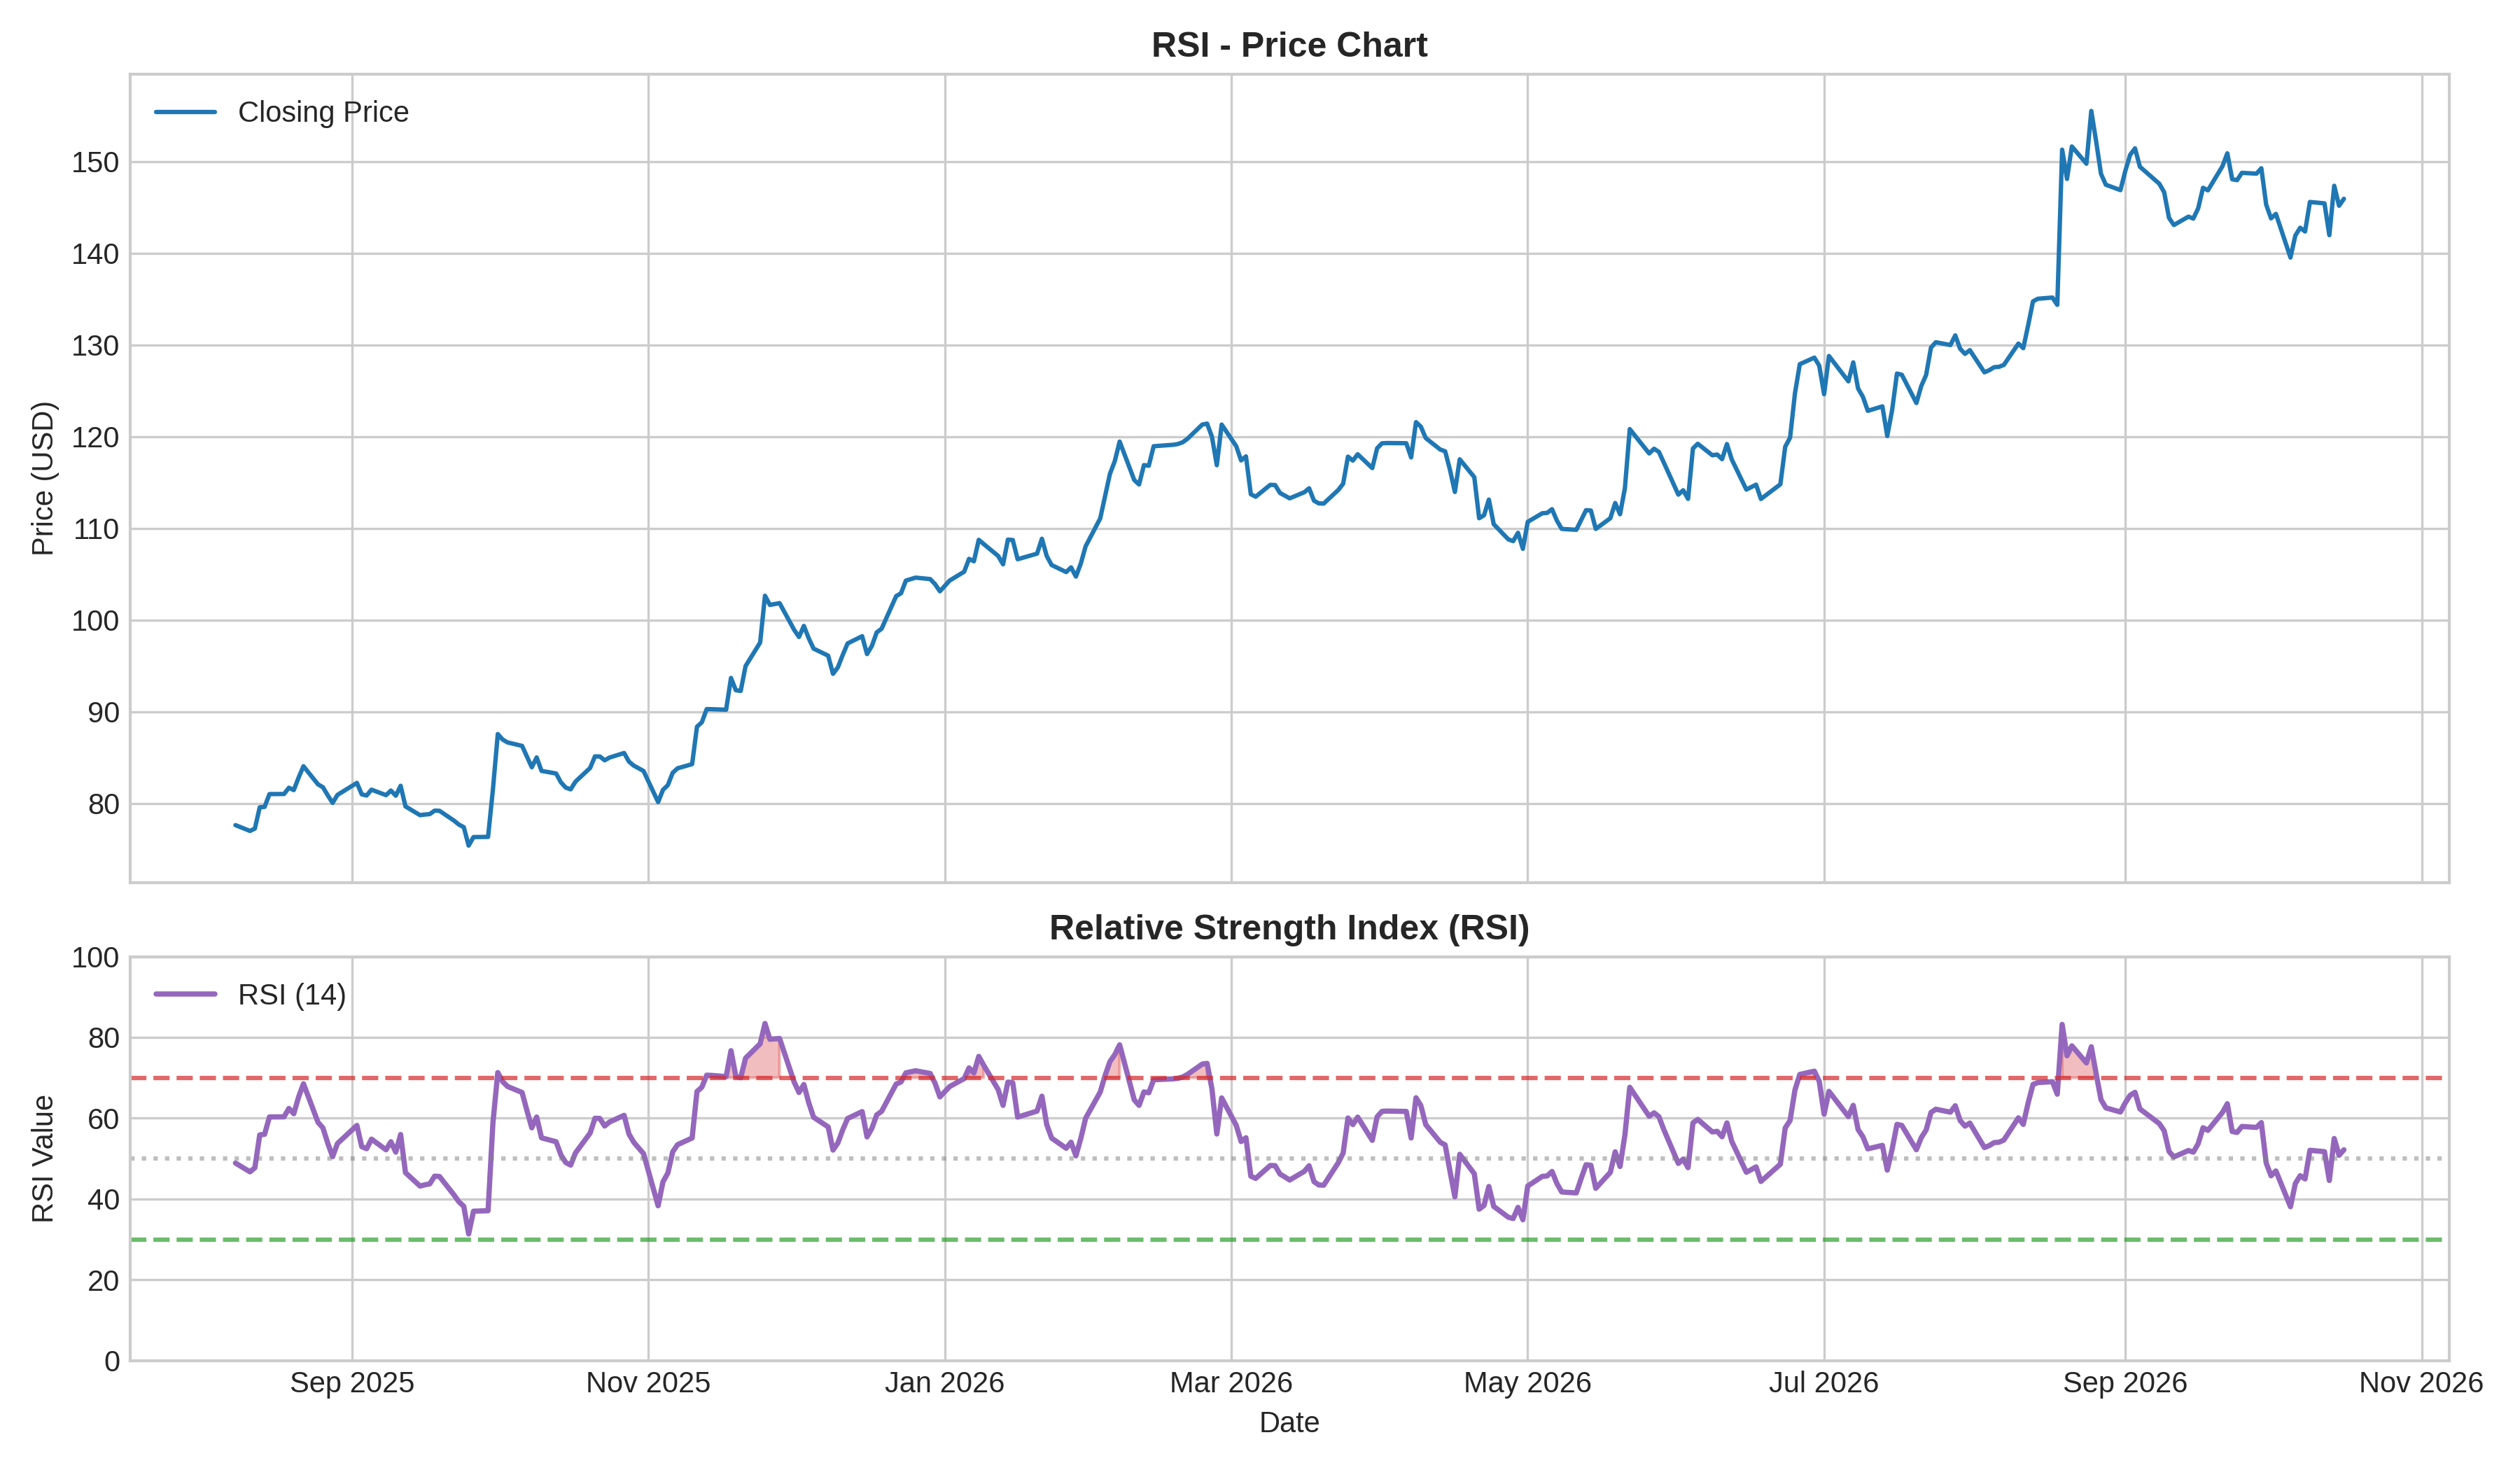
What it measures:
RSI is a momentum oscillator bounded between 0 and 100 that measures the speed and change of recent price movements to evaluate overbought or oversold market conditions.
How to interpret it:
- Overbought / Oversold: RSI readings above 70 indicate overbought conditions; readings below 30 indicate oversold conditions.
- 50 Centerline: Crossing above 50 indicates bullish momentum control; crossing below 50 indicates bearish control.
- Divergence: Higher price highs with lower RSI highs warn of impending trend exhaustion.
Used for:
- Identifying overextended price levels and potential mean-reversion points.
- Confirming overall market momentum and divergence signals.
Limitations:
- During strong secular bull or bear trends, RSI can remain overbought or oversold for extended periods.
- Can yield premature reversal signals in strong momentum markets.