
Donchian Channels
What is it?
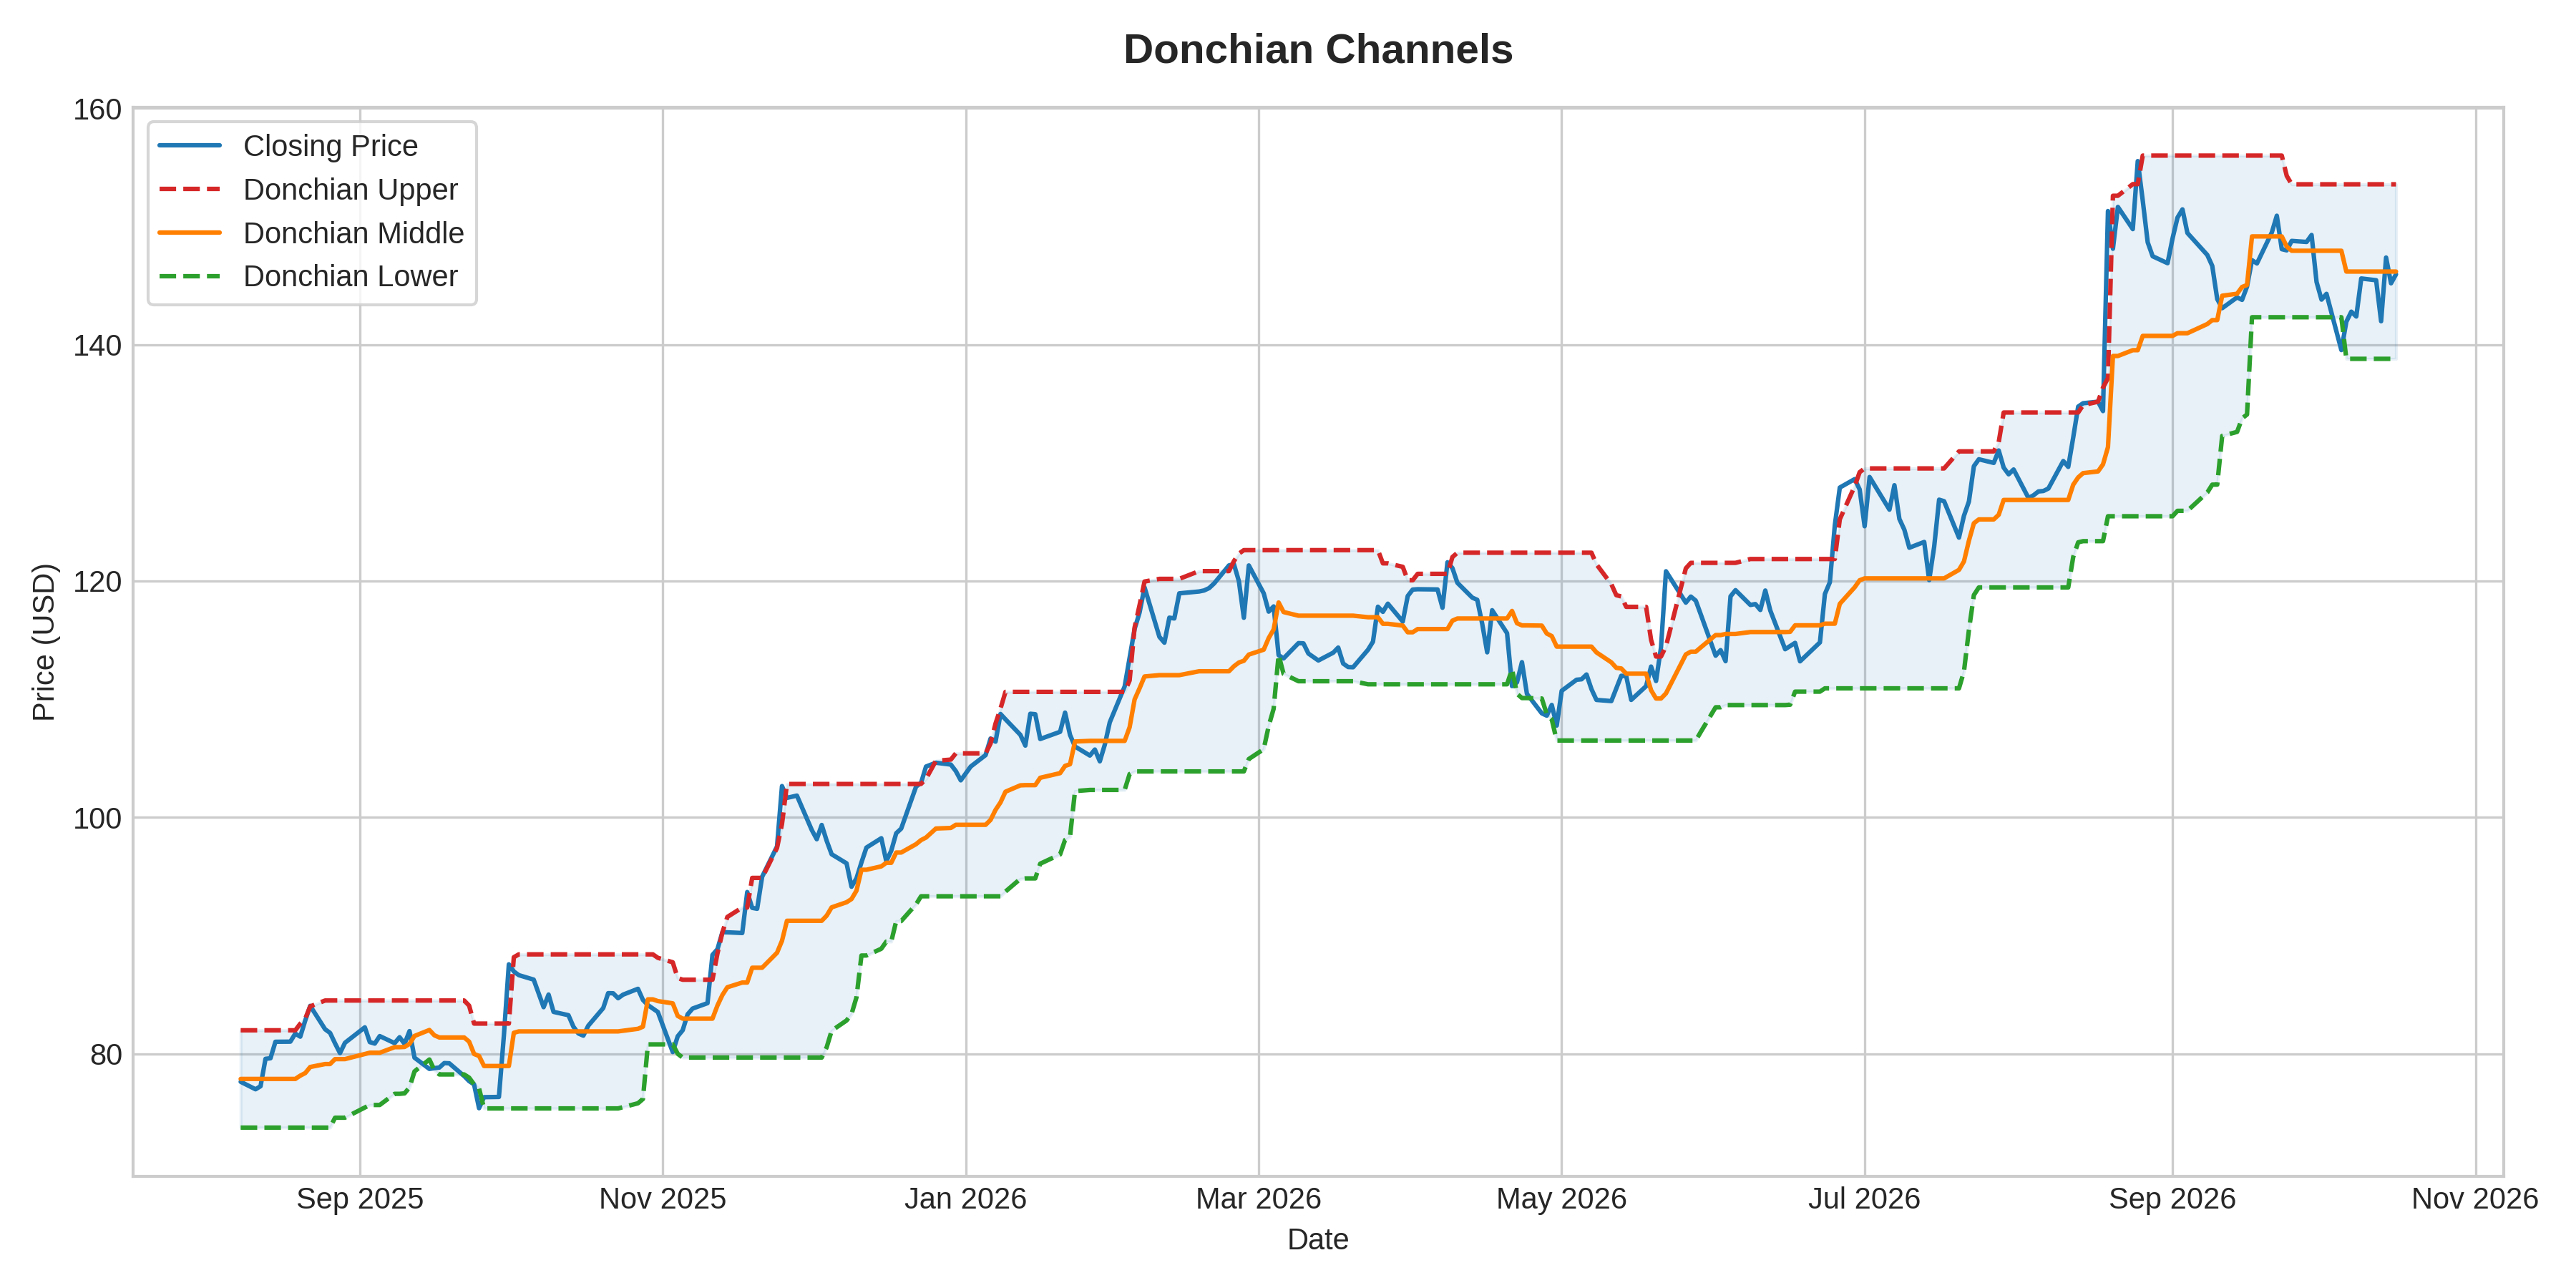
What it measures:
Calculates the highest high and lowest low over N periods to plot channel boundaries around price action.
How to interpret it:
- Upper Line Breakout: Touching or breaking the upper Donchian boundary signals an N-period high breakout.
- Middle Line: Represents the mean of highest high and lowest low, acting as trend baseline.
Used for:
- Systematic trend-following breakout strategies (e.g., Turtle Trading).
Limitations:
- Produces false breakout signals in choppy, non-trending markets.