
Weighted Moving Average (WMA)
What is it?
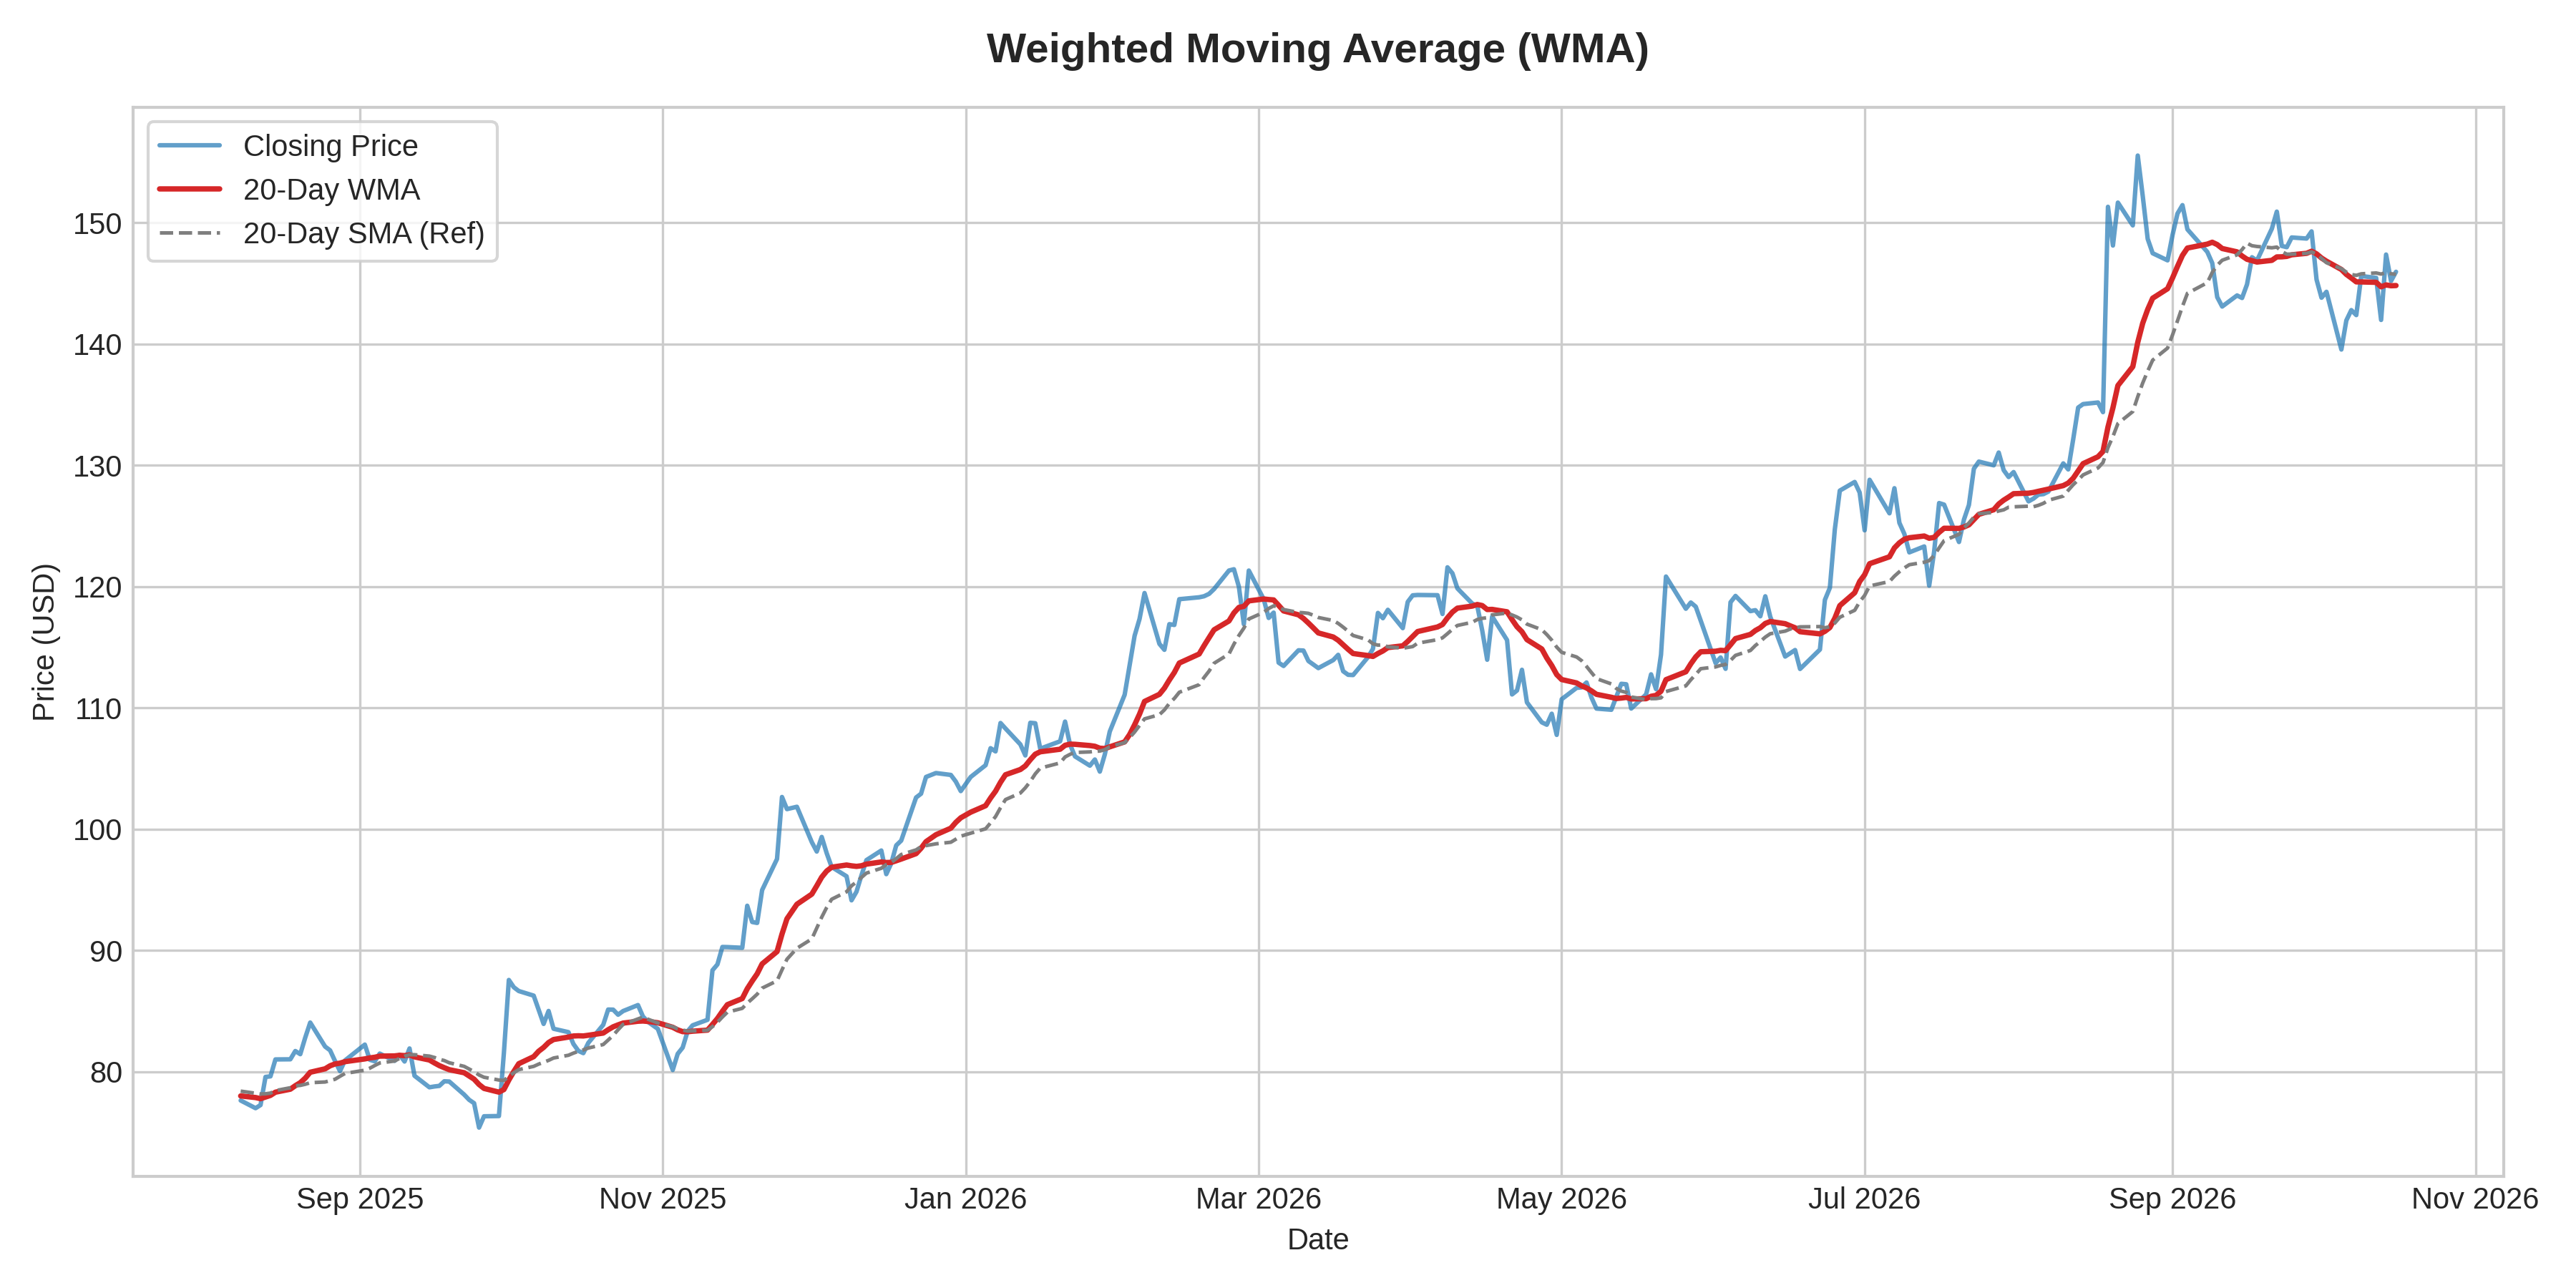
What it measures:
The Weighted Moving Average (WMA) assigns linearly increasing weights to more recent price data points, giving recent price action greater significance than older data within the specified period.
How to interpret it:
- Faster Reaction: WMA tracks price direction changes faster than SMA because recent price points carry linearly higher weight.
- Trend Identification: A rising WMA signals an accelerating uptrend, whereas a declining WMA indicates downside price pressure.
- Support/Resistance: Dynamic support and resistance lines form along key WMA periods during sustained moves.
Used for:
- Short-term momentum tracking.
- Reducing price lag compared to SMA without complex smoothing algorithms.
Limitations:
- Can produce false breakout signals in choppy, sideways markets.
- More sensitive to sharp short-term price spikes than SMA.