
Sine Wave Cycle Indicator
What is it?
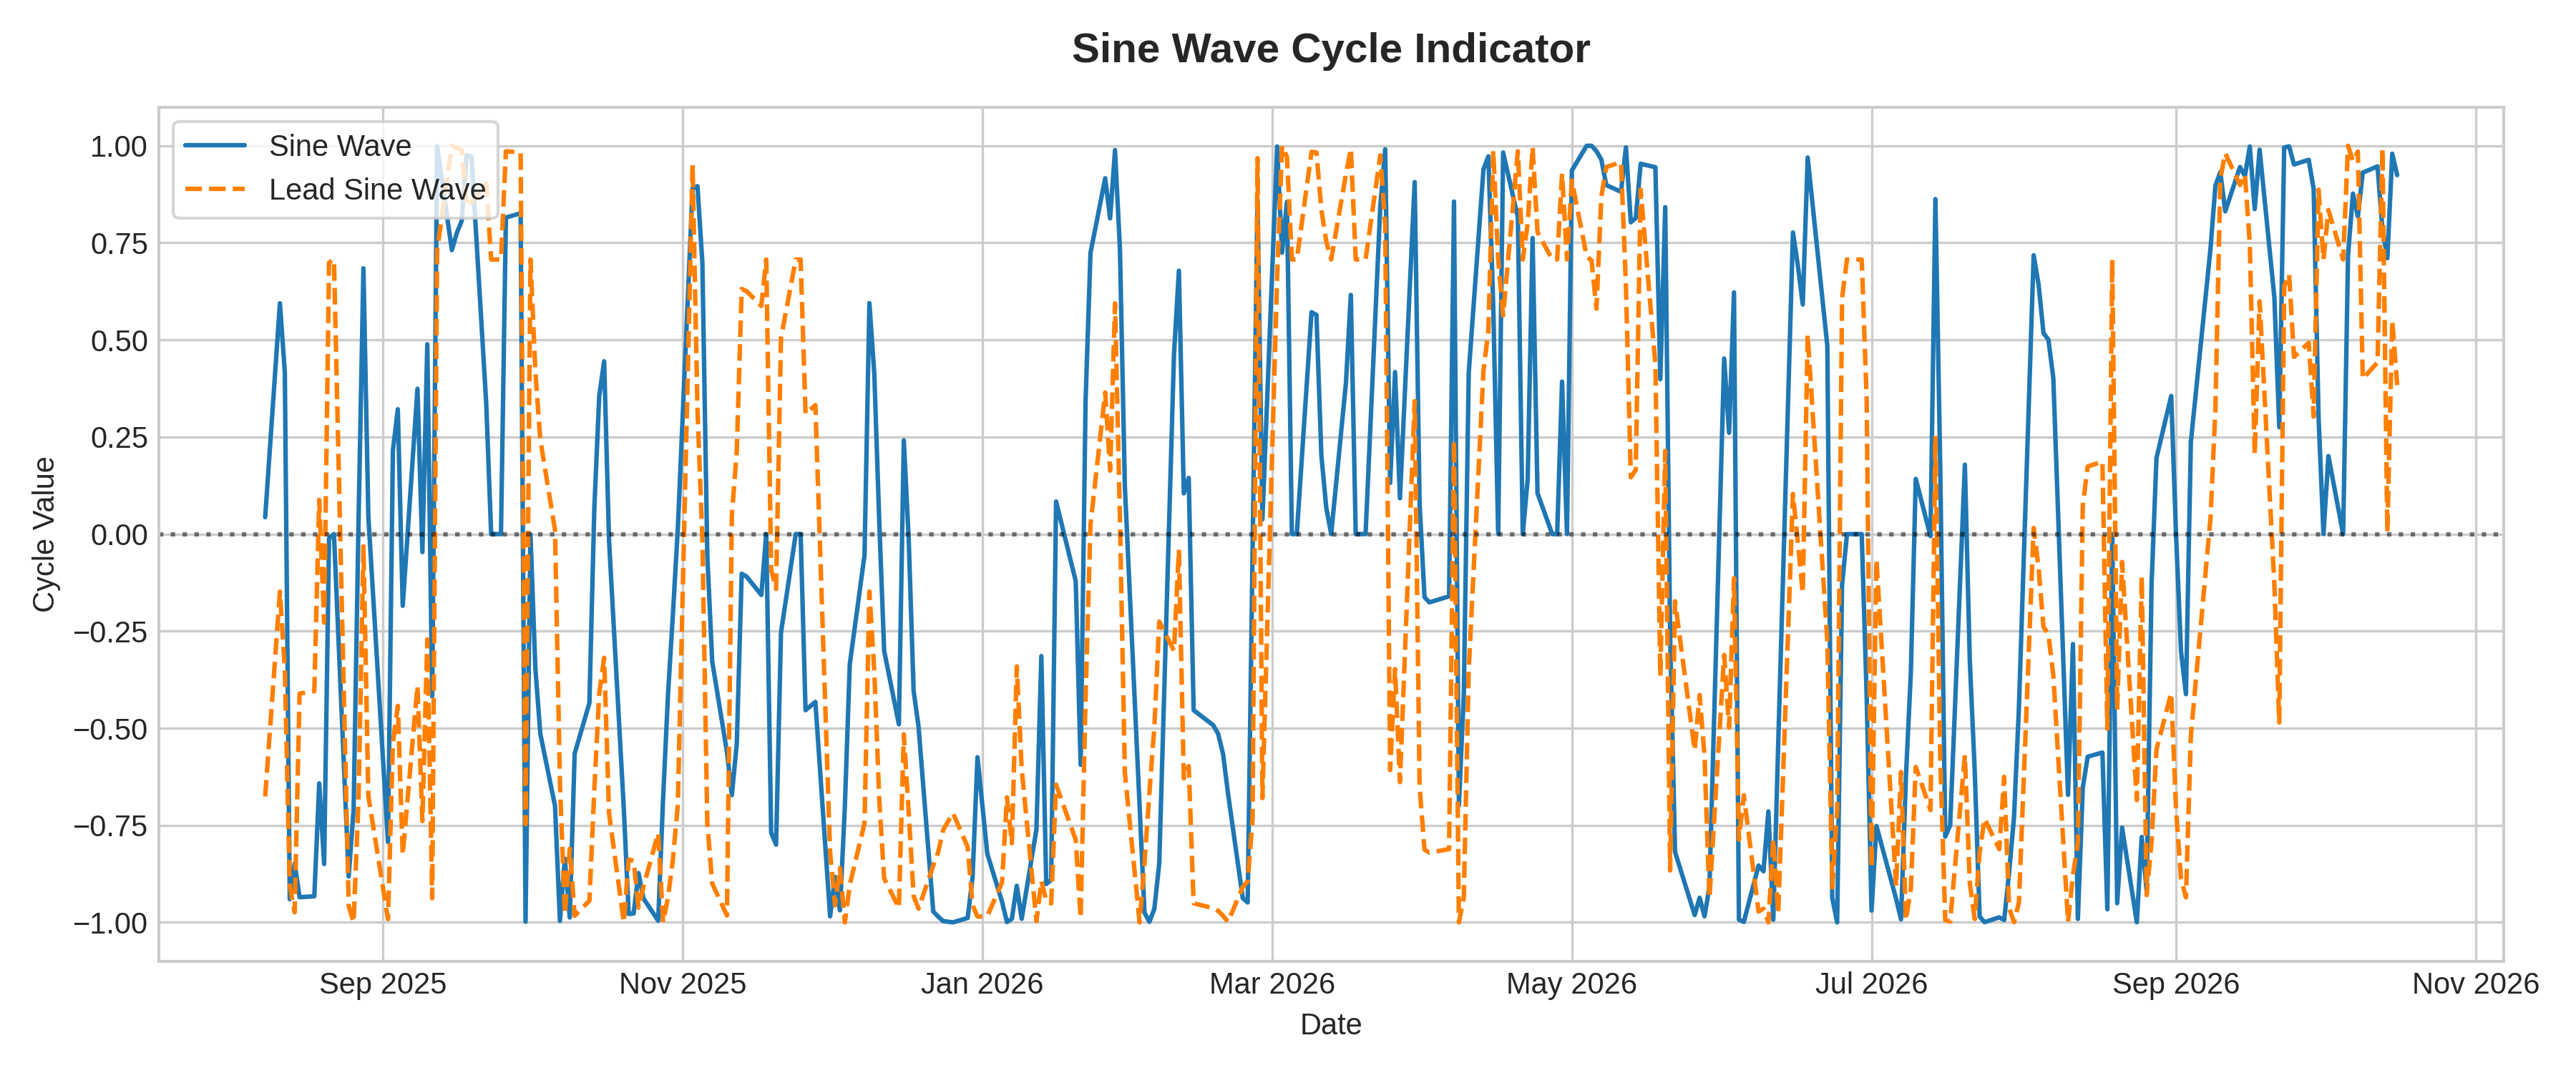
What it measures:
Uses Hilbert Transform cycle algorithms to identify cyclical market turning points.
How to interpret it:
- Crossover Signal: Lead Sine crossing above Sine Wave signals a cyclical low buy setup.
- Trend Mode Failure: In strong trend regimes, Sine Wave lines remain parallel and do not cross cleanly.
Used for:
- Pinpointing cyclic turning points in non-trending range markets.
Limitations:
- Yields false signals when markets transition from cyclic modes into strong trends.