
Exponential Moving Average (EMA)
What is it?
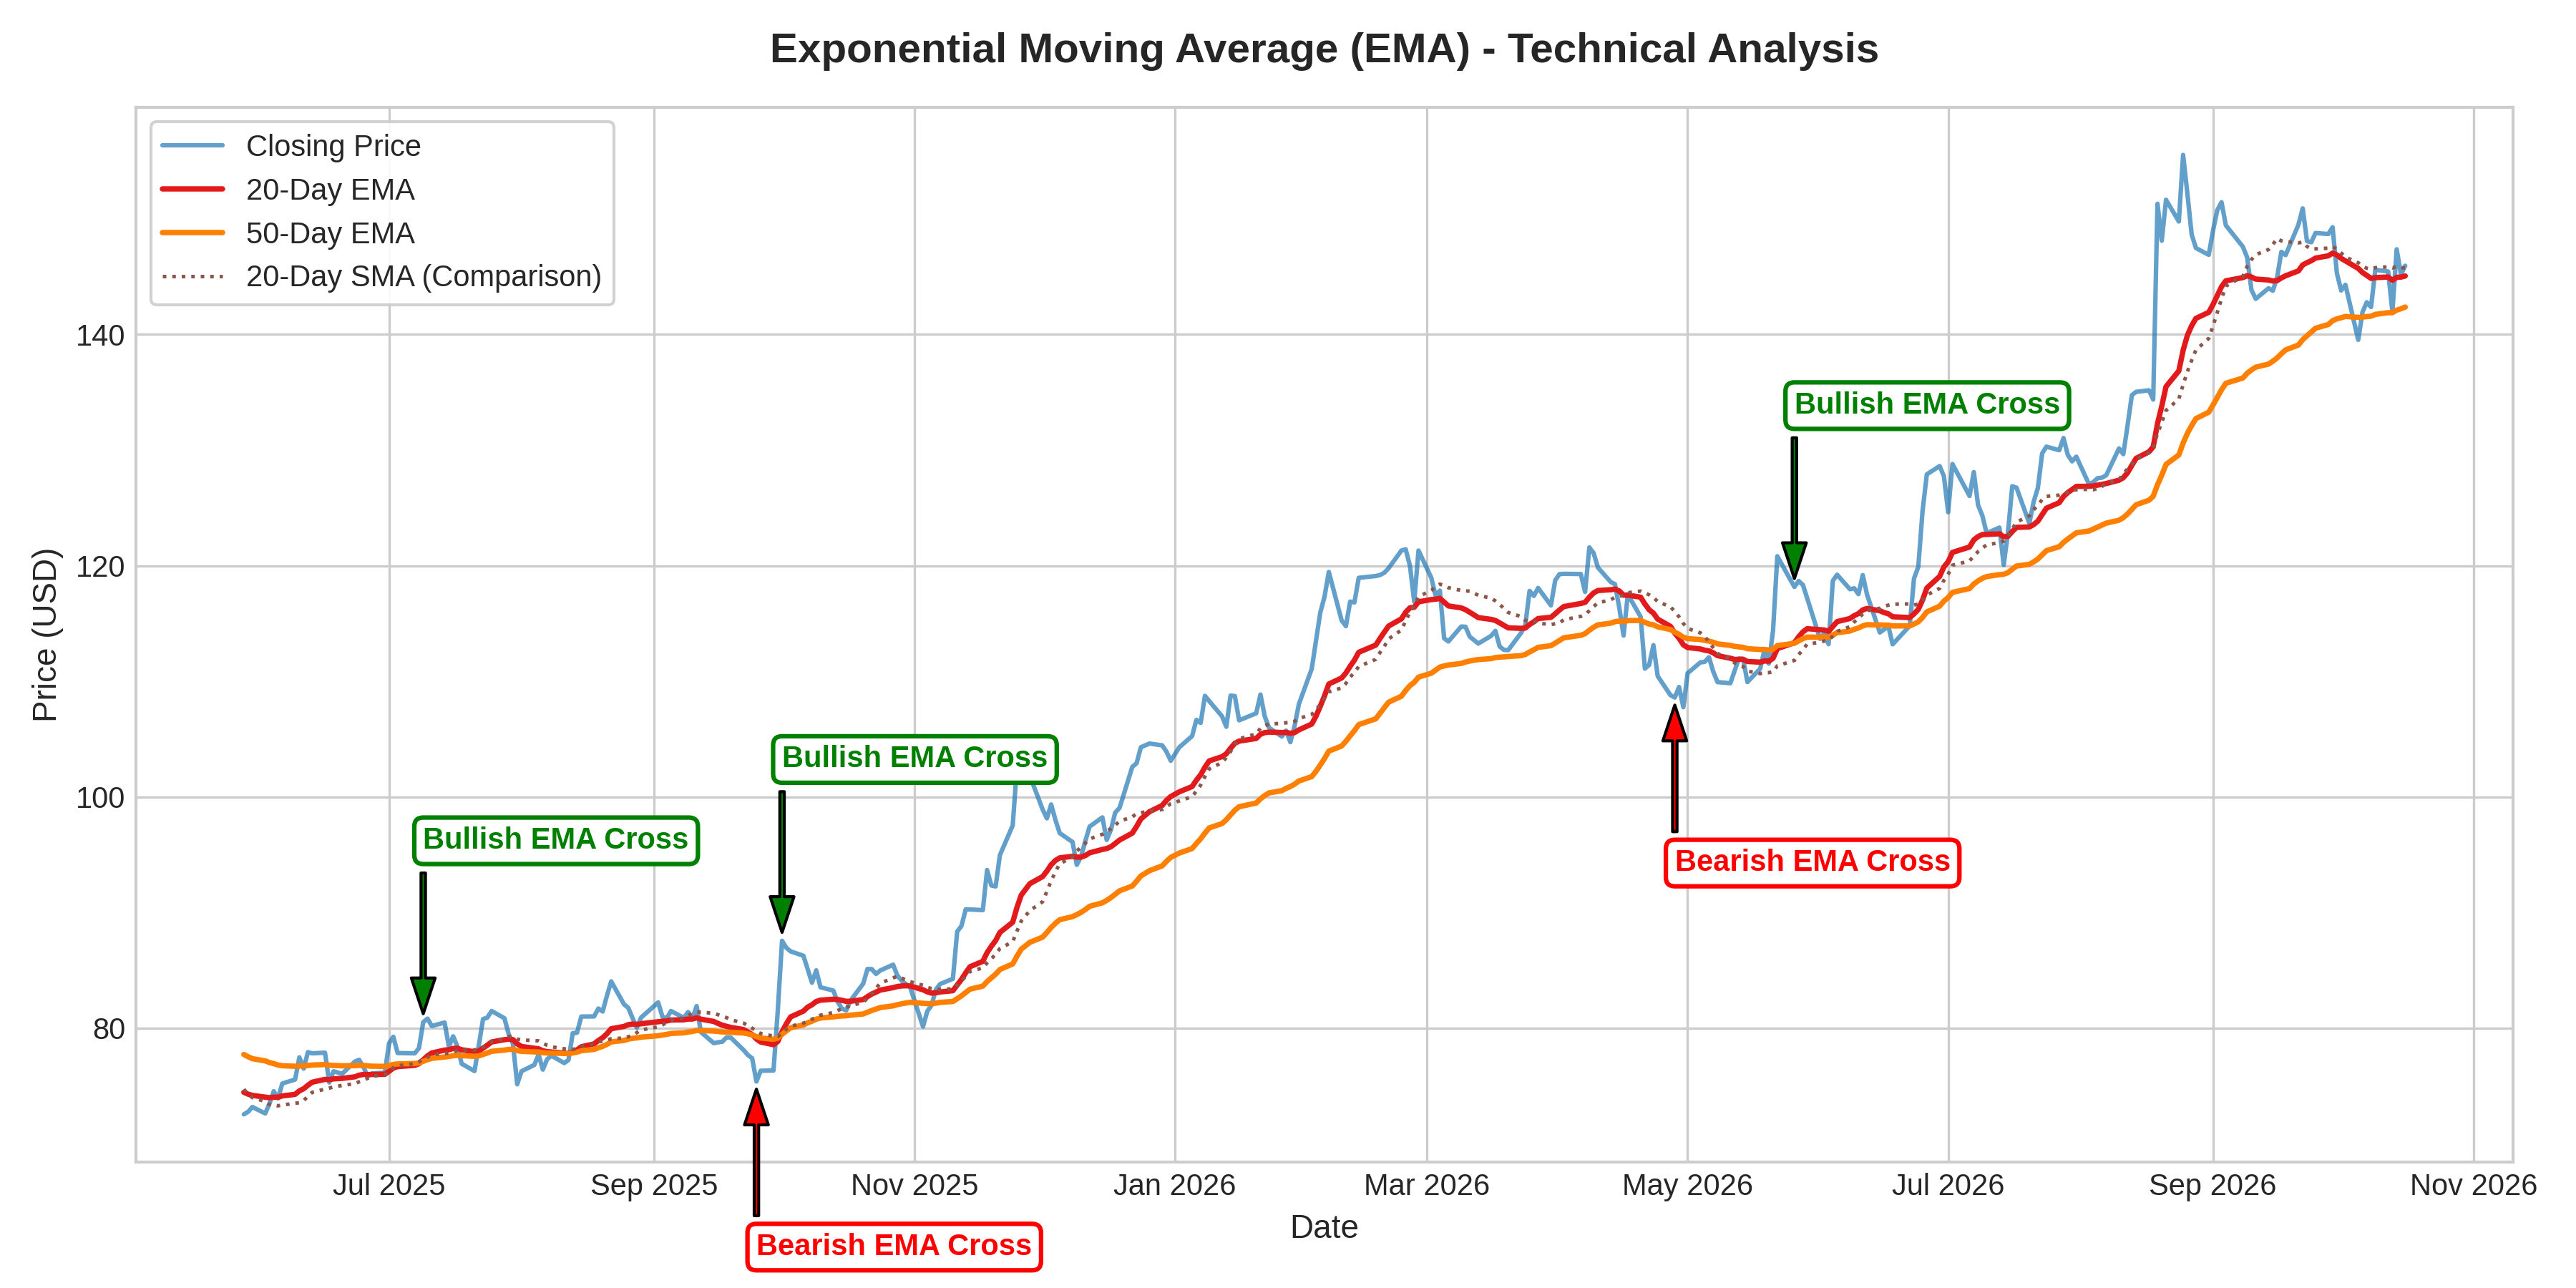
What it measures:
The Exponential Moving Average (EMA) measures the weighted average price of an asset over a designated timeframe, assigning higher weight and significance to the most recent price points. Because of this weighting, the EMA reacts faster to recent price action than a Simple Moving Average (SMA).
How to interpret it:
- Trend Sensitivity: A sharply sloping EMA signals accelerating momentum in the direction of the slope.
- Dynamic Support/Resistance: Traders often watch key EMAs (like the 20-EMA or 50-EMA) as dynamic pullback bounce points during ongoing trends.
- Fast Crossovers: A short-period EMA crossing above a longer-period EMA confirms emerging bullish momentum earlier than SMA crossovers.
Used for:
- Short-term and swing trading entry and exit timing.
- Tracking rapid shifts in momentum before lagged indicators catch up.
- Serving as core inputs for complex indicators like MACD and PPO.
Limitations:
- Susceptible to False Signals: High responsiveness means EMA can trigger false signals during minor price spikes or volatile consolidations.
- Requires Trend Context: Performs poorly in choppy, range-bound market environments where price frequently whipsaws across the line.