
Price Z-Score
What is it?
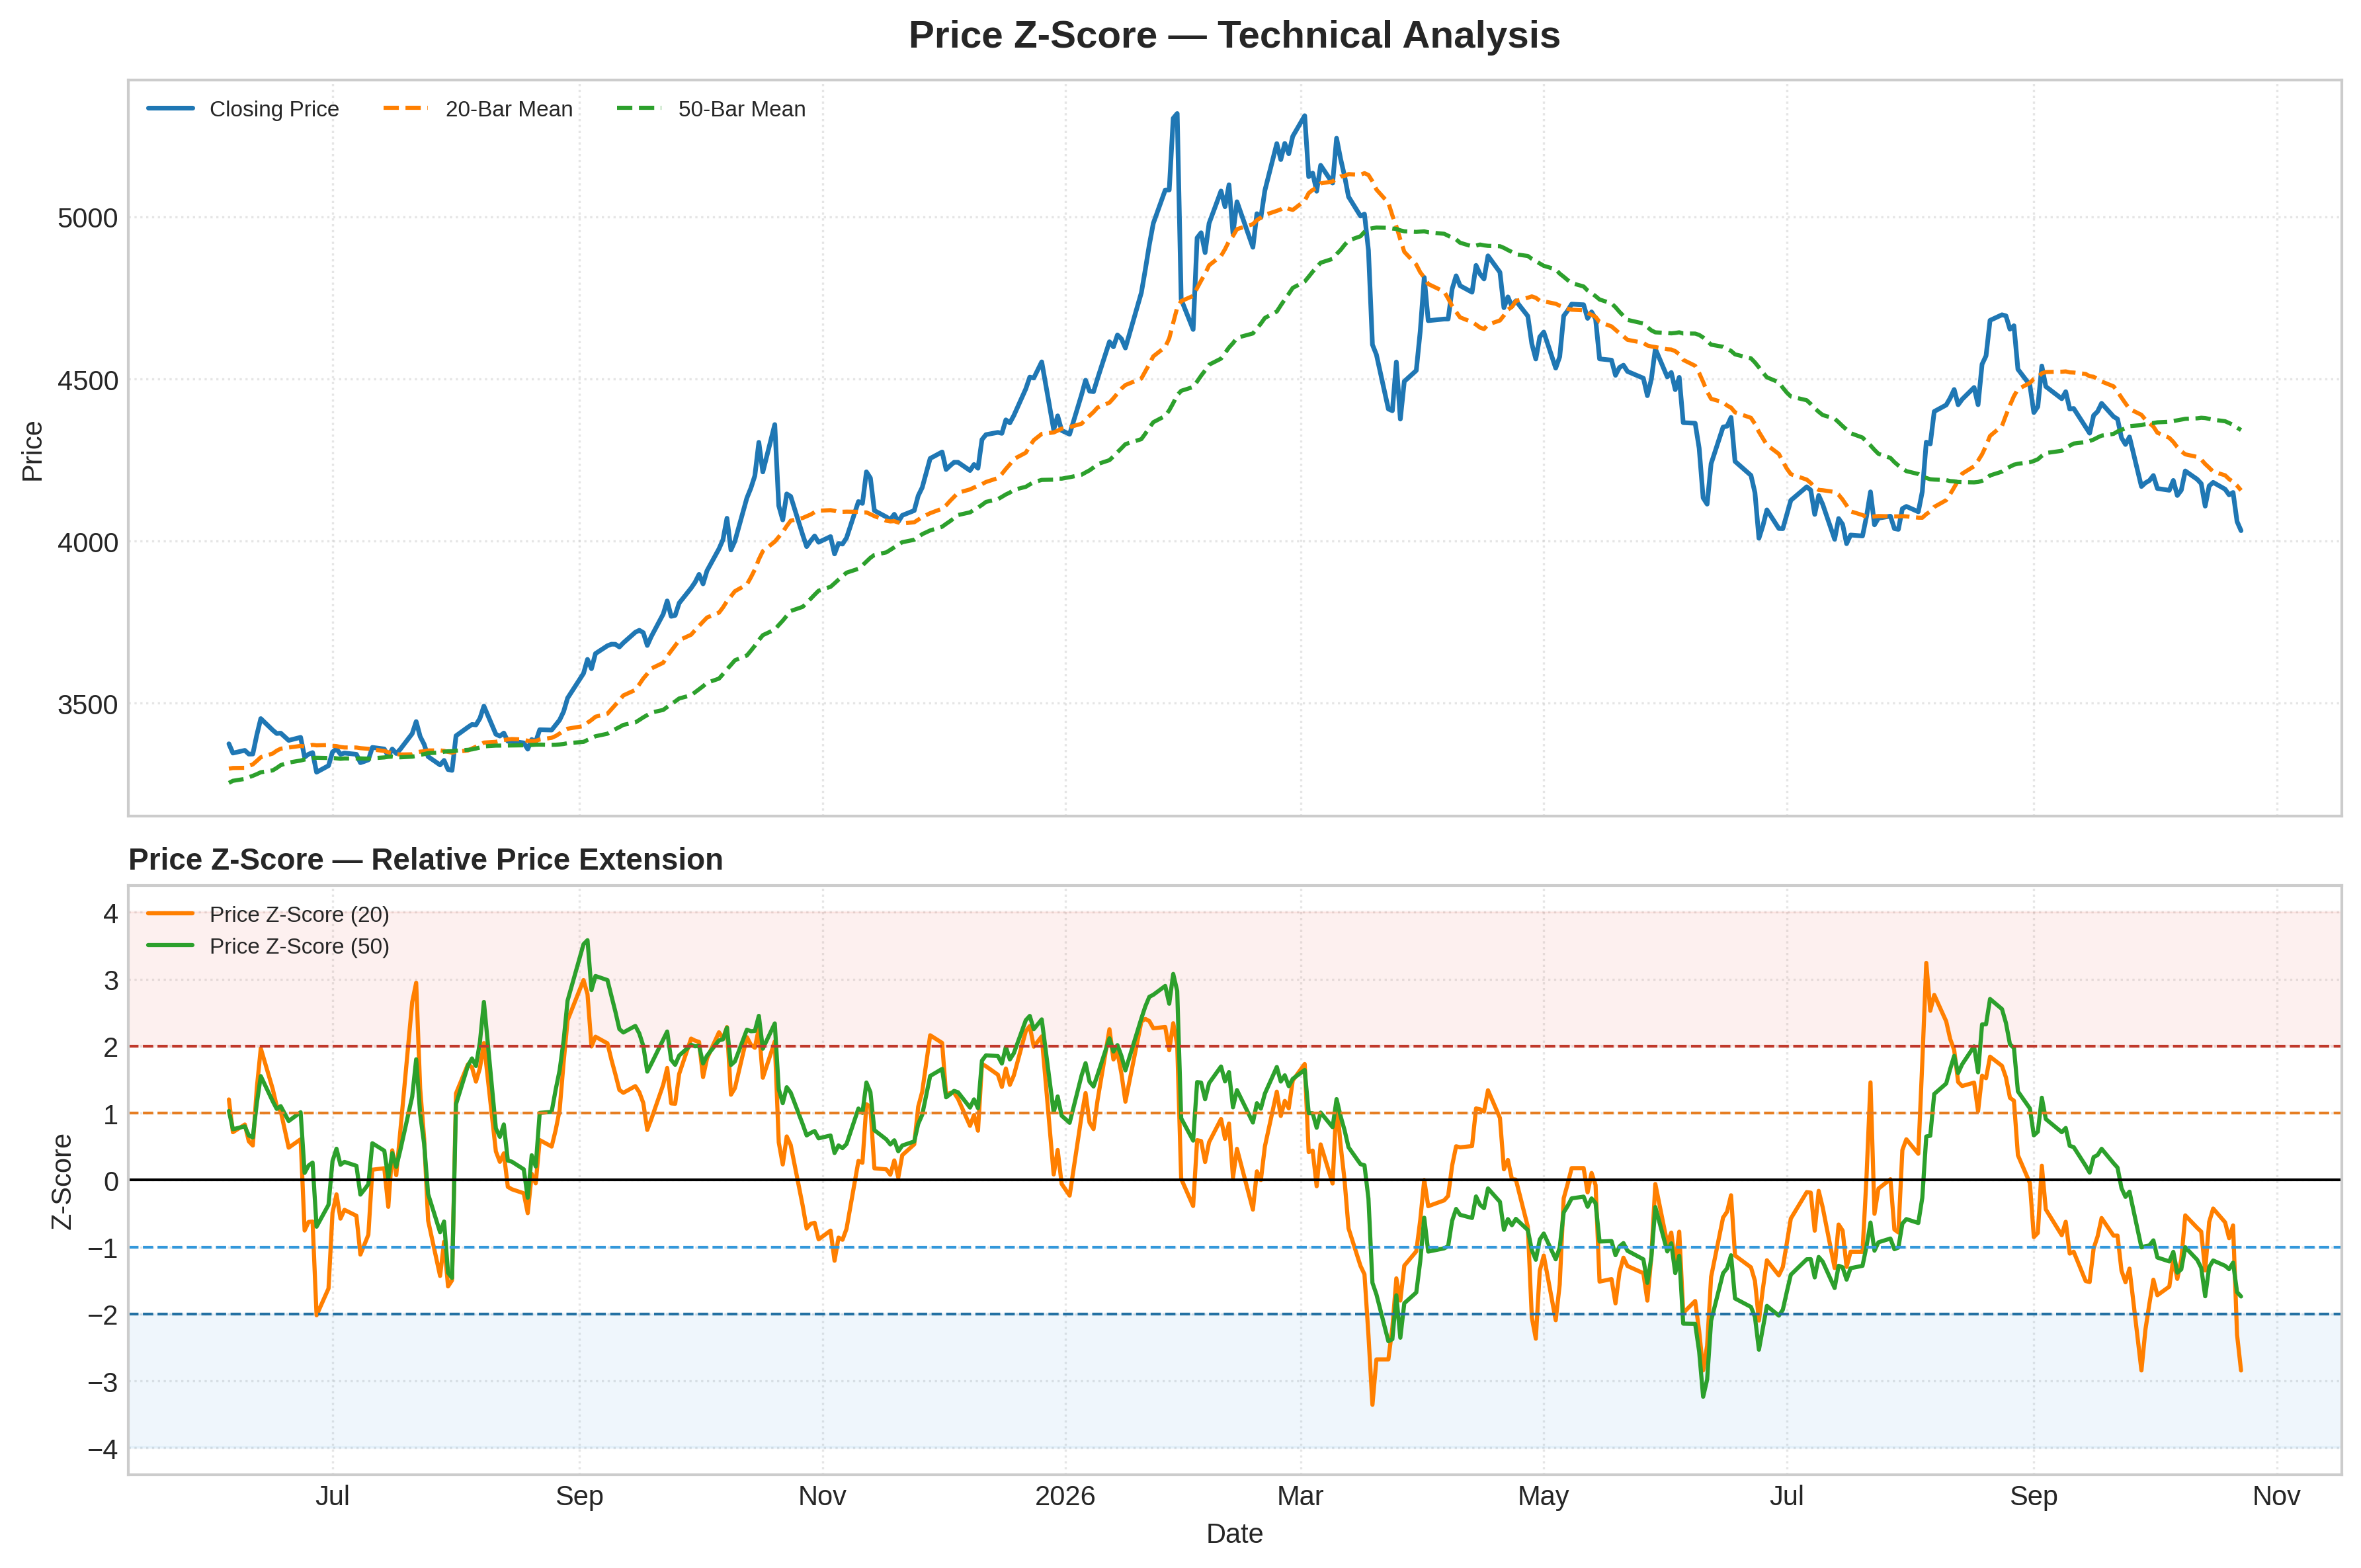
What it measures:
Measures how far the current closing price deviates from its rolling historical mean, expressed in standard deviations. Uses rolling Price Z-Scores to assess relative price extension and identify prices that are unusually high or low compared with their recent distribution.
How to interpret it:
- Z-Score > +2.0: Price is unusually high relative to its rolling mean and may be extended.
- Z-Score < -2.0: Price is unusually low relative to its rolling mean and may be depressed.
- Z-Score Between -1 and +1: Price is within one standard deviation of its rolling mean.
- Z-Score Near Zero: Price is close to its recent rolling mean.
- Rising Z-Score: Price is moving higher relative to its rolling mean and standard deviation.
- Falling Z-Score: Price is moving lower relative to its rolling mean and standard deviation.
- Comparison Across Windows: Shorter windows respond more quickly to price changes, while longer windows provide broader context for price extension.
Used for:
- Identifying unusually high or low prices relative to recent history.
- Detecting potential mean-reversion setups when combined with reversal confirmation.
- Assessing price extension within an established trend.
- Combining with Linear Regression Slope, moving averages, ADX, and momentum indicators to distinguish trend continuation from potential exhaustion.
- Generating normalized features for quantitative trading models and cross-asset analysis.
Limitations:
- A Z-Score beyond ±2.0 does not automatically imply a reversal or a BUY/SELL signal; prices can remain extended during strong trends.
- Price Z-Score measures deviation from a rolling price mean, not the statistical significance of returns or the probability of a future reversal.
- Results depend on the rolling window, standard deviation calculation, and market regime.
- Trending and non-stationary price series may produce persistent high or low Z-Scores.
- Volatility-regime shifts and extreme observations can distort the rolling mean and standard deviation.
- A near-zero Z-Score does not necessarily indicate a sideways market; price may be following a strong trend near its rolling mean.