
Parabolic SAR (Stop and Reverse)
What is it?
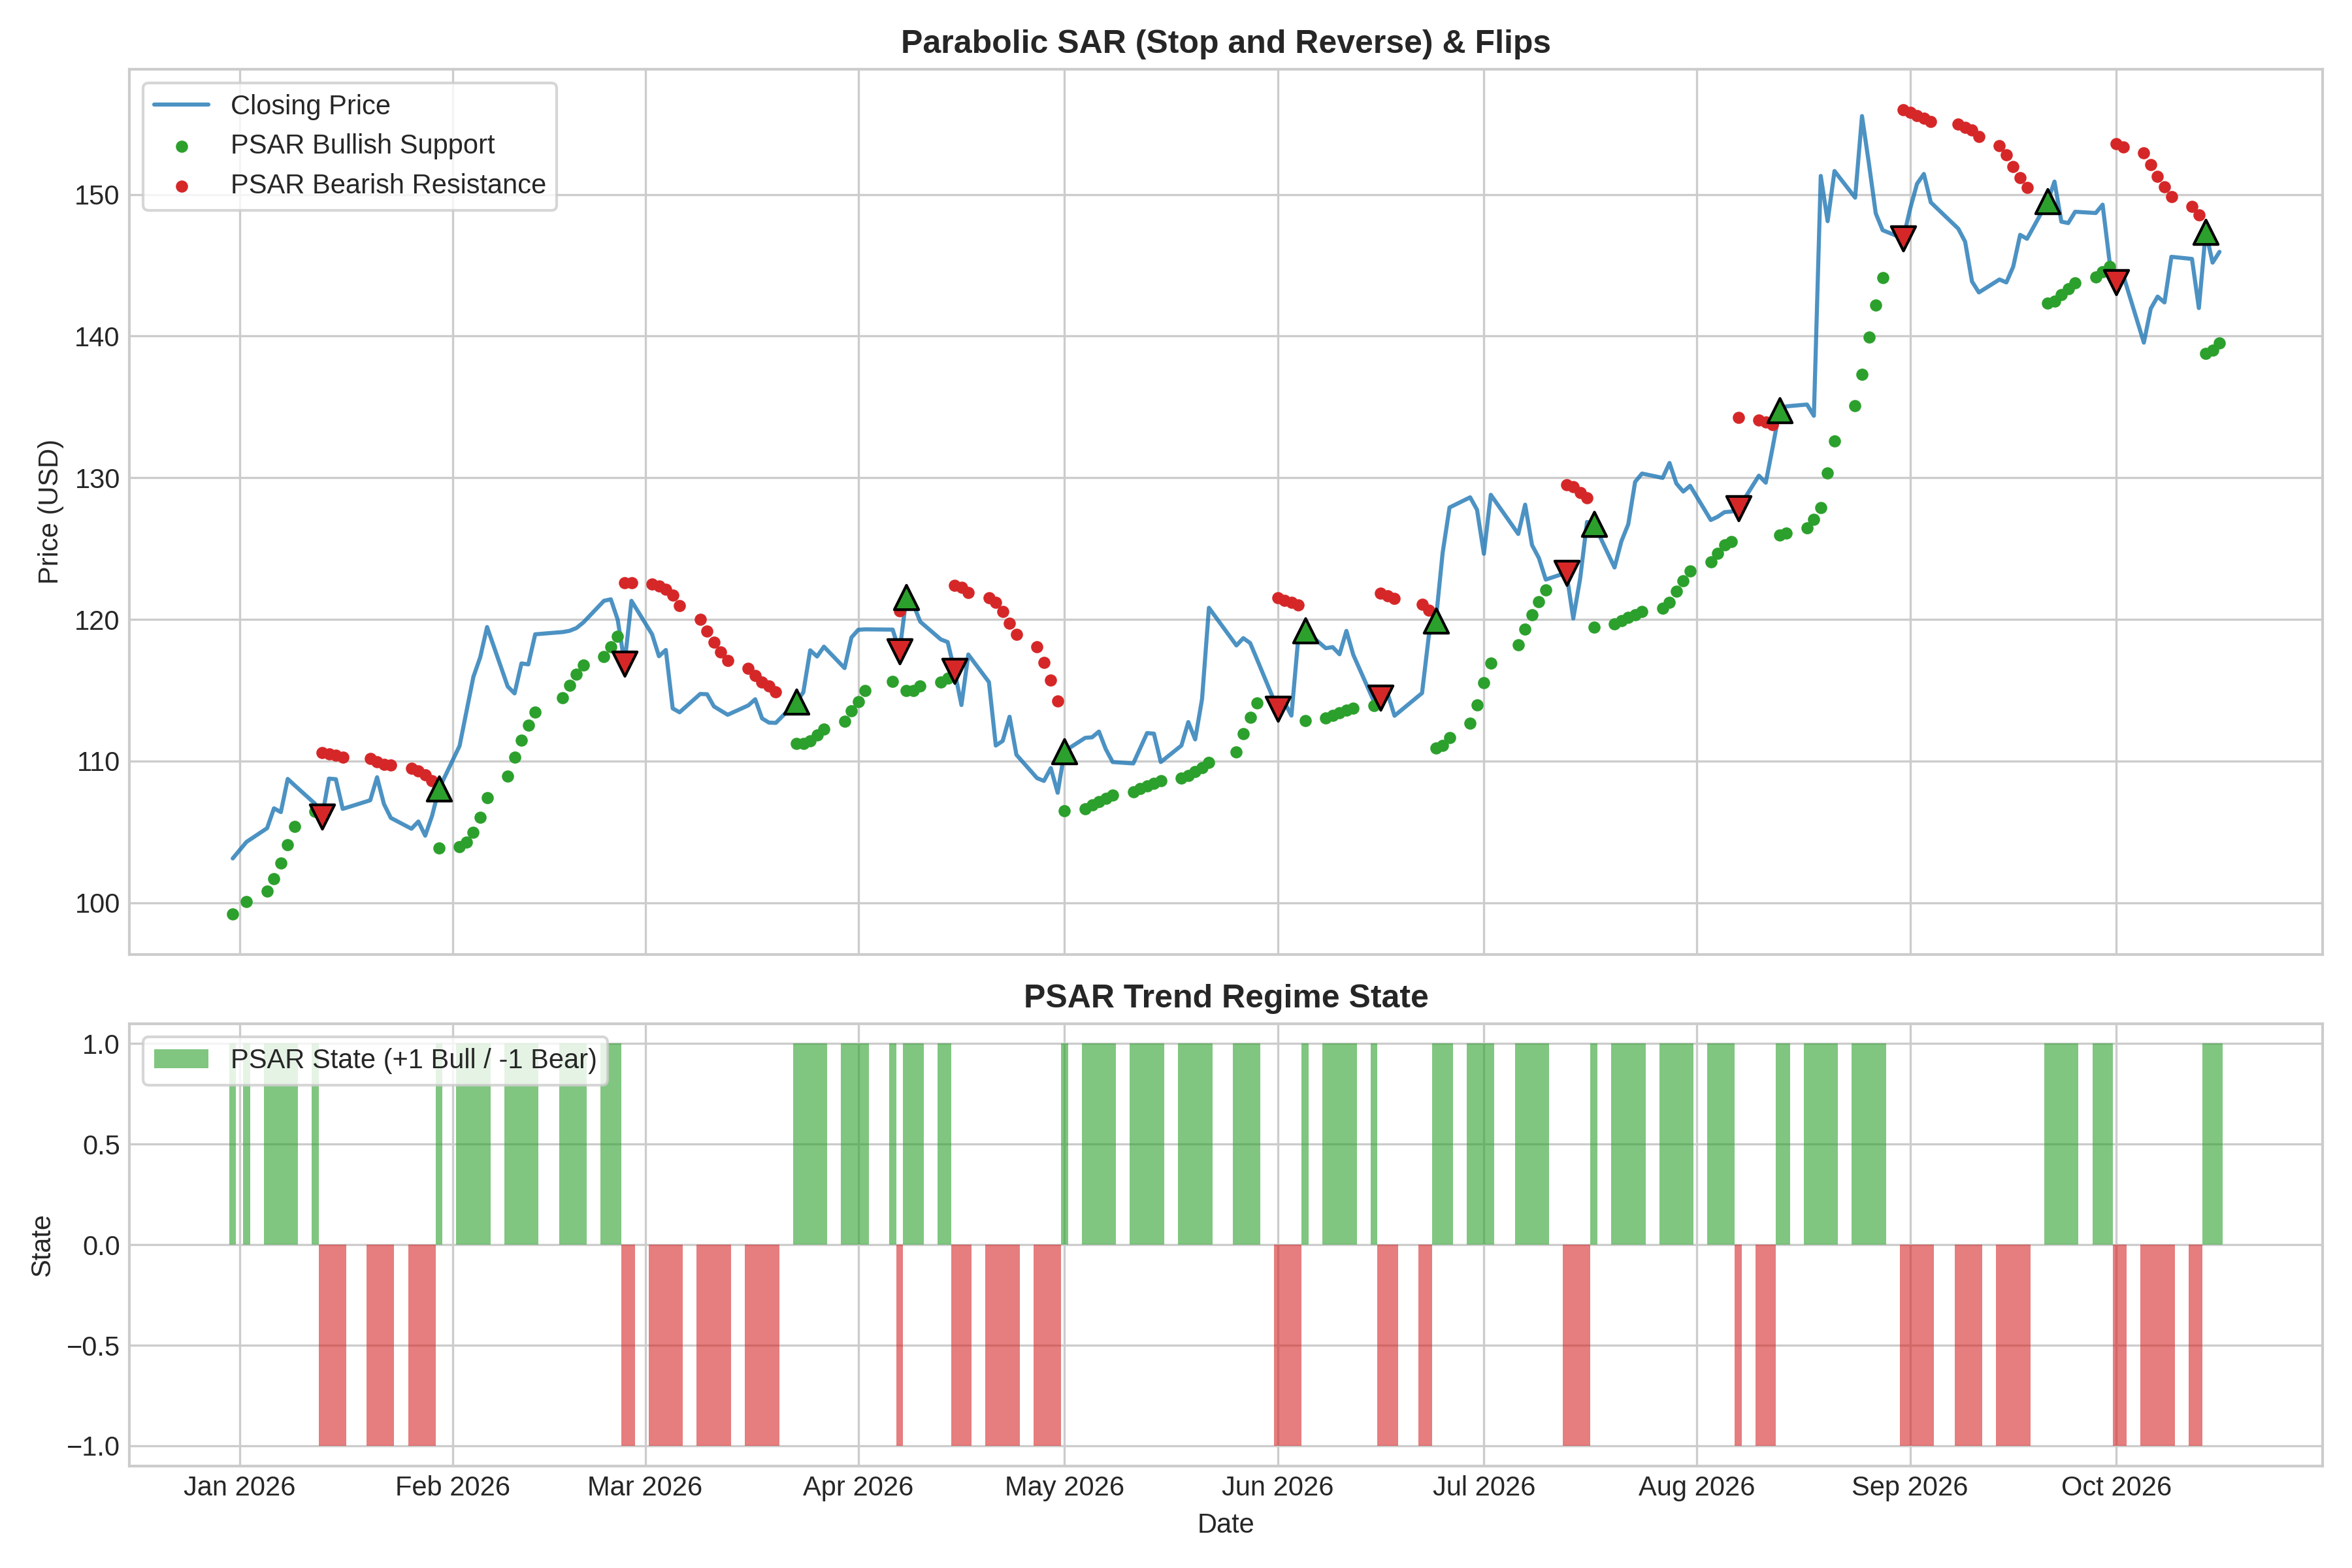
What it measures:
Developed by J. Welles Wilder, the Parabolic SAR sets trailing price stops that accelerate as a trend progresses. It tracks price level bounds (`ind_trn_psar`), discrete directional trend regimes (`state_psar`), and momentum reversal signals (`evt_psar_flip`).
How to interpret it:
- PSAR Dots Position (`ind_trn_psar`): Dots trailing below price confirm a bullish trend (acting as dynamic trailing support); dots trailing above price confirm a bearish trend (acting as dynamic trailing resistance).
- Flip Events (`evt_psar_flip`): Triggered when price penetrates the active SAR level, signalling an immediate trend reversal and trailing stop modification.
- Acceleration Factor: The distance between SAR dots widens rapidly during explosive trend extensions as the acceleration factor increases.
Used for:
- Setting strict trailing stop-loss levels during strong directional trends.
- Triggering position exits or reversal trades upon `evt_psar_flip` confirmation.
Limitations:
- Choppy / Sideways Markets: Generates frequent false flip signals and whipsaws during non-trending range bound consolidation.
- Should be paired with trend strength indicators like ADX to filter signals when ADX < 20.