
Ichimoku Cloud (Ichimoku Kinko Hyo)
What is it?
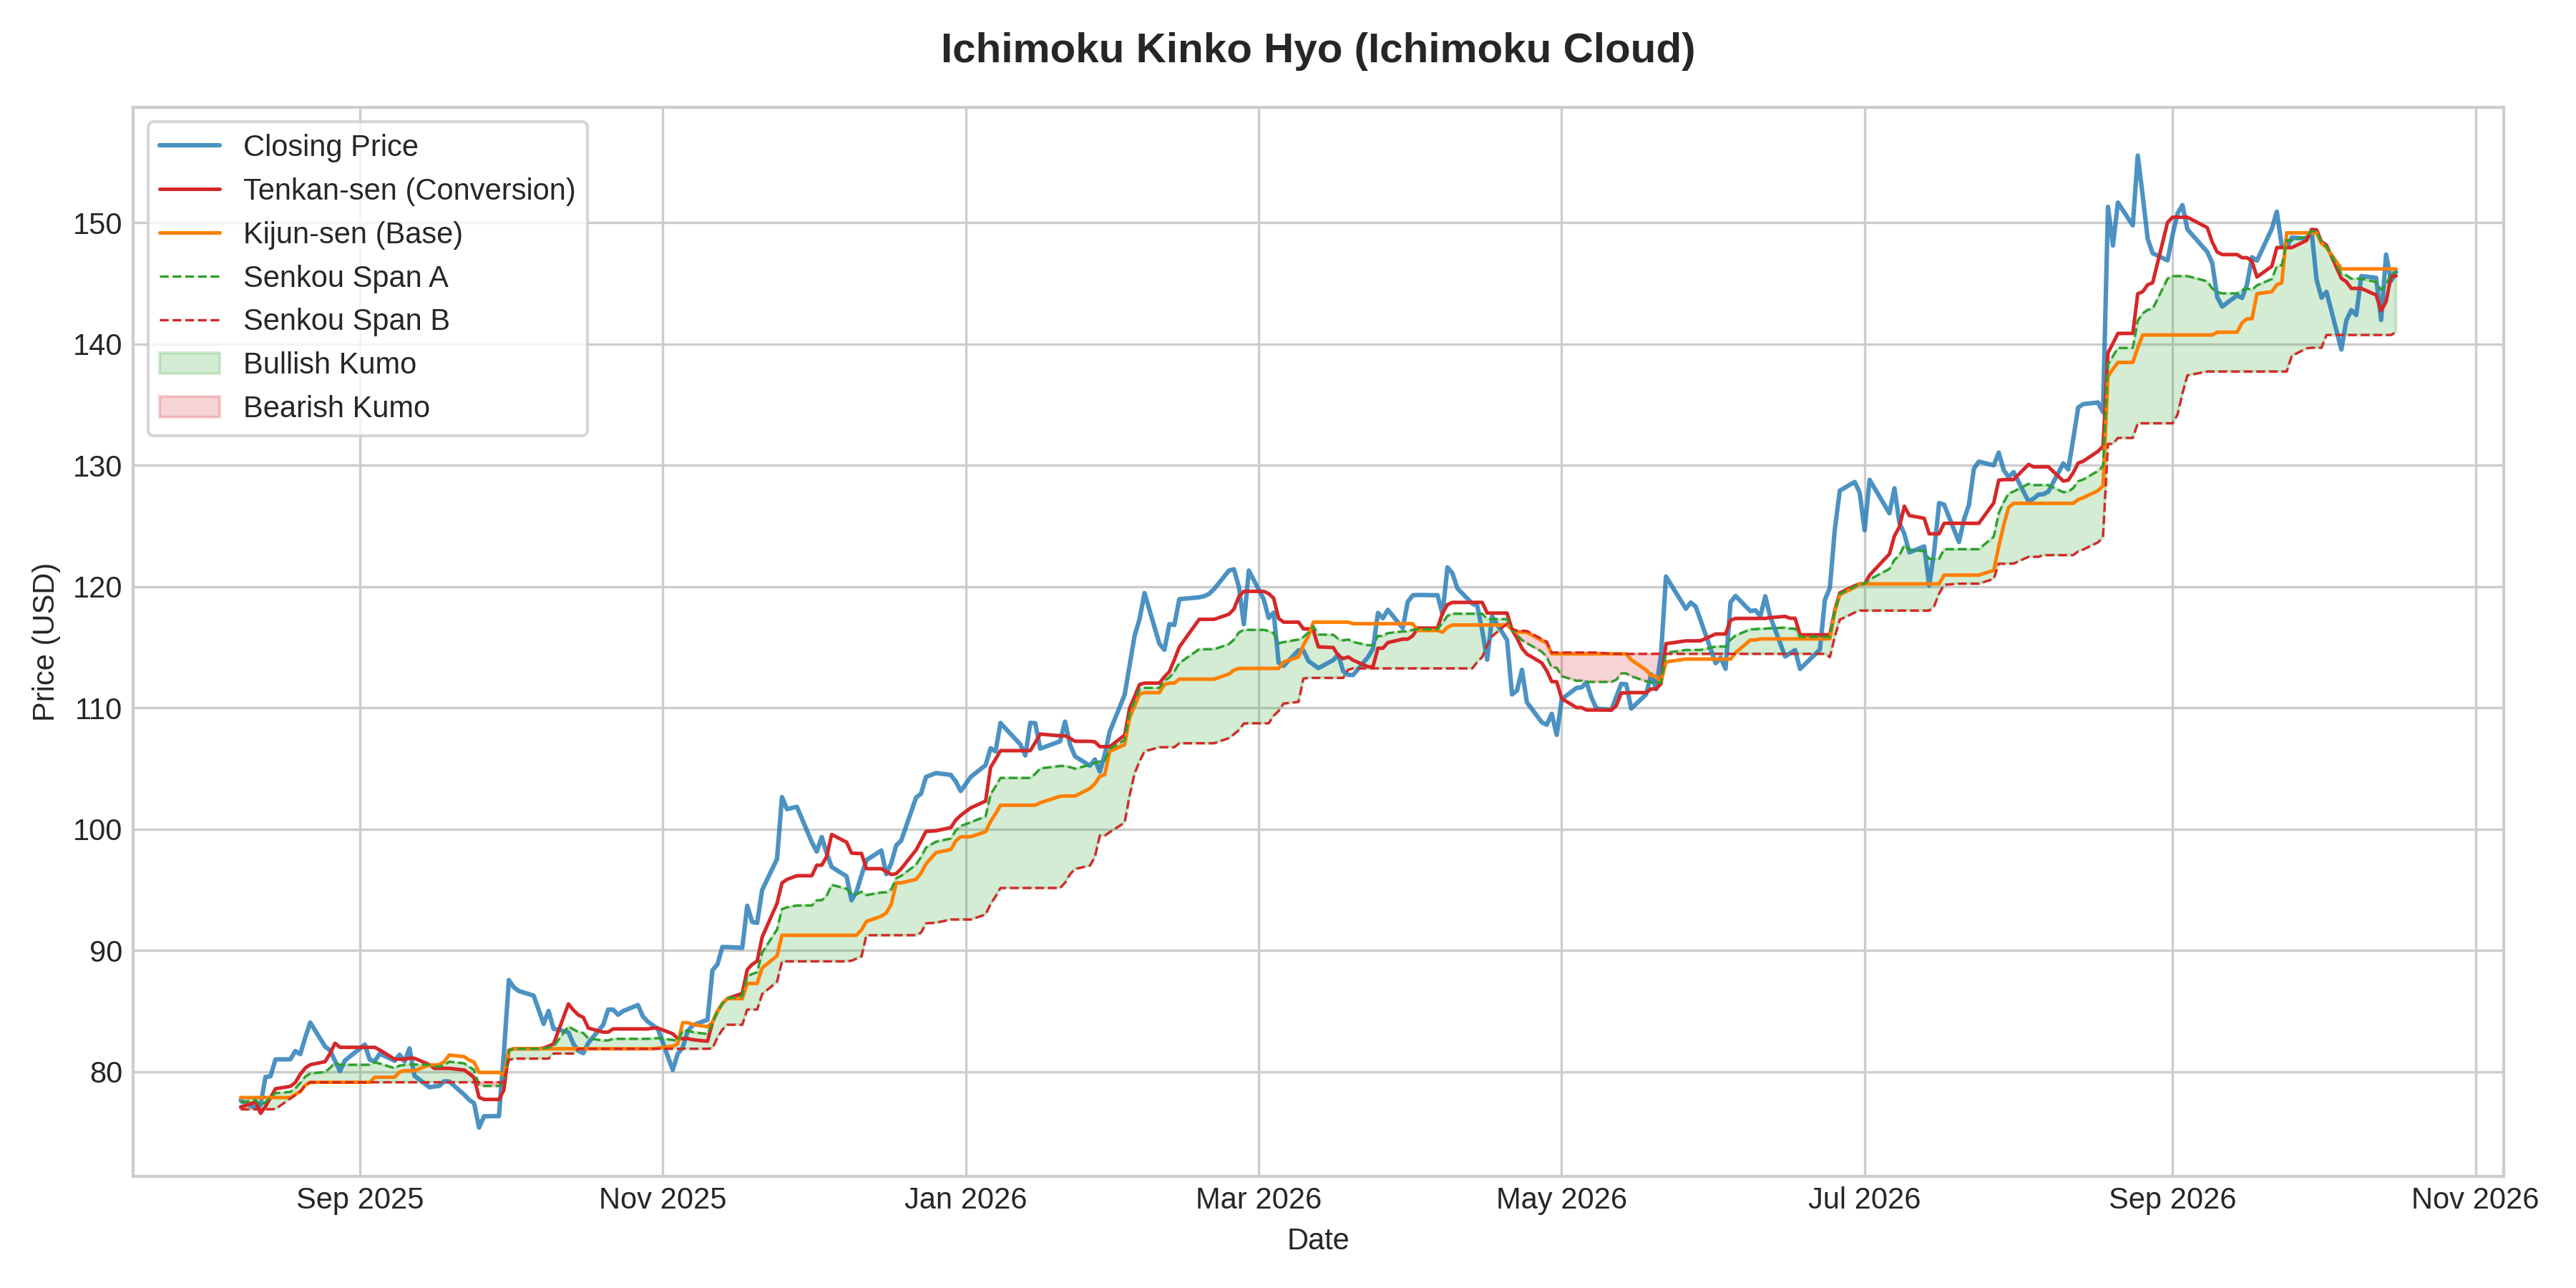
What it measures:
Ichimoku Cloud defines support and resistance zones, trend direction, momentum, and buy/sell signals in a single comprehensive visual system consisting of five key lines.
How to interpret it:
- Cloud Position: Price trading above the Kumo Cloud indicates a strong bullish regime; trading below indicates a bearish regime.
- Cloud Color: Green cloud (Span A > Span B) signifies bullish structure; Red cloud signifies bearish structure.
- TK Cross: Tenkan-sen crossing above Kijun-sen forms a bullish momentum entry signal.
Used for:
- Complete technical trend identification and dynamic support/resistance mapping.
- Evaluating trend strength and prospective future price boundaries.
Limitations:
- Can appear visually cluttered to beginner traders.
- Generates delayed crossover signals in tight range-bound markets.