
Bollinger Bands
What is it?
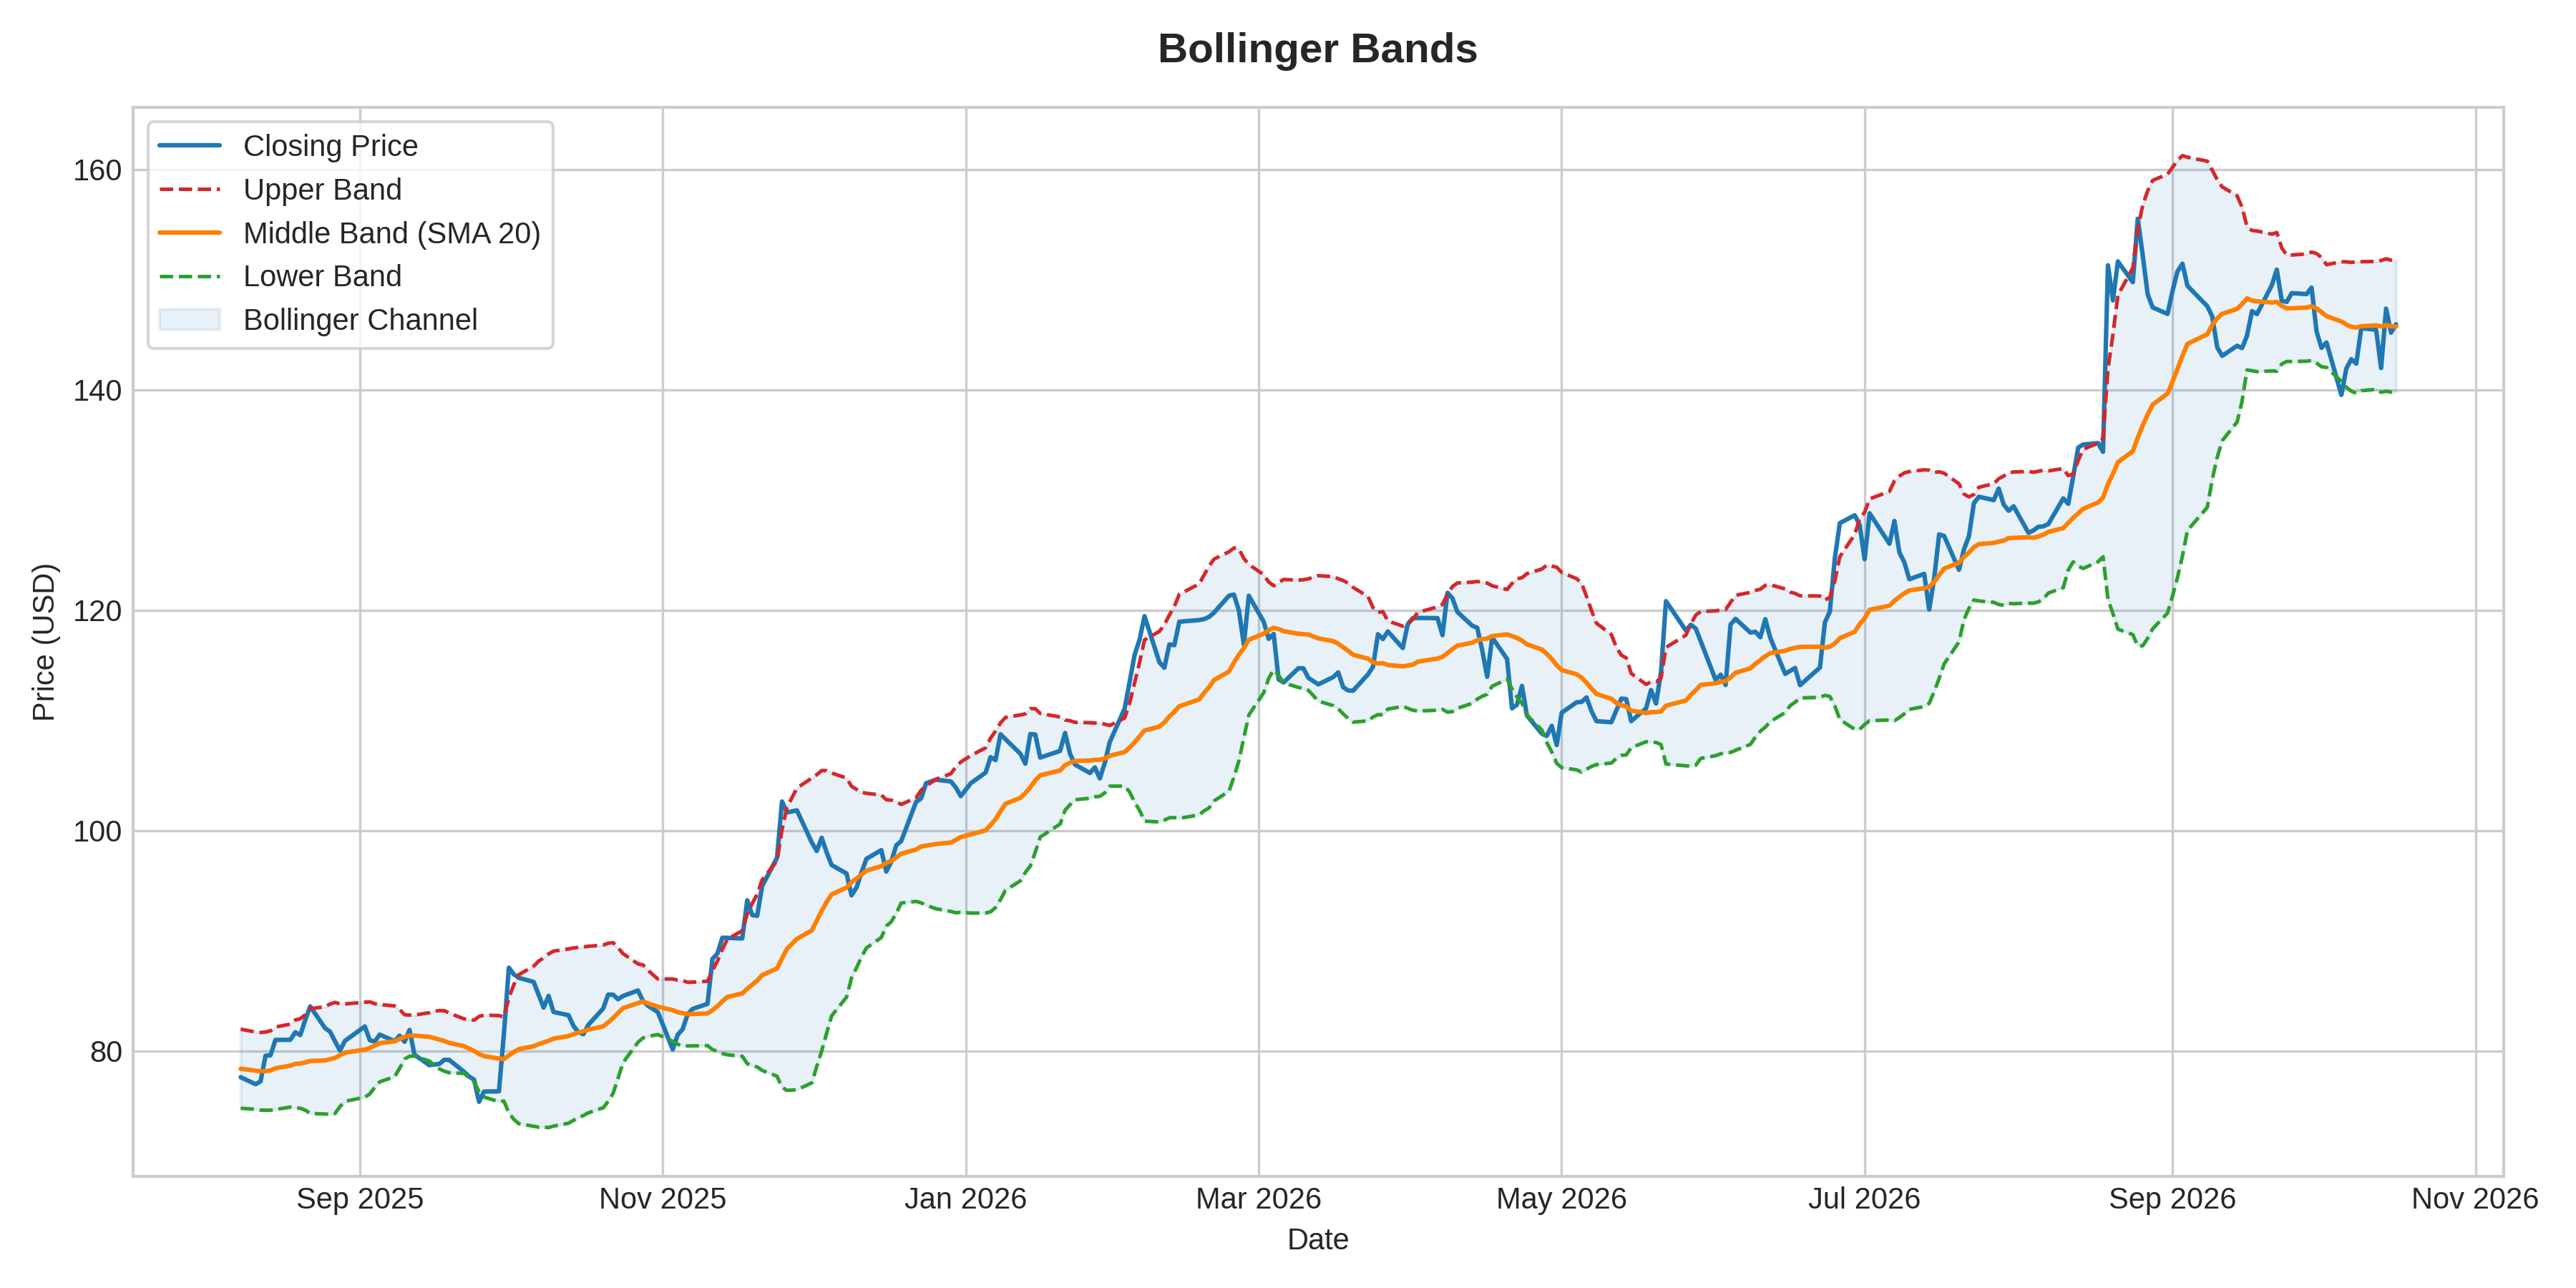
What it measures:
Bollinger Bands consist of a middle simple moving average (usually 20 periods) and two outer volatility bands set at standard deviation distances (usually 2 standard deviations) above and below the middle line.
How to interpret it:
- Volatiliy Squeeze: Narrowing bands indicate low volatility, often preceding explosive directional breakouts.
- Overbought / Oversold: Price touching or exceeding the upper band signals relatively overbought conditions; touching the lower band signals oversold conditions.
- Band Walking: Price continually riding the upper or lower band indicates strong sustained momentum rather than an immediate reversal.
Used for:
- Measuring market volatility regimes and contraction/expansion cycles.
- Identifying breakout conditions and extreme price levels.
Limitations:
- Does not specify breakout direction during volatility squeezes.
- Price can continue 'walking the band' during strong secular trends, leading to premature counter-trend trades.