
Commodity Channel Index (CCI)
What is it?
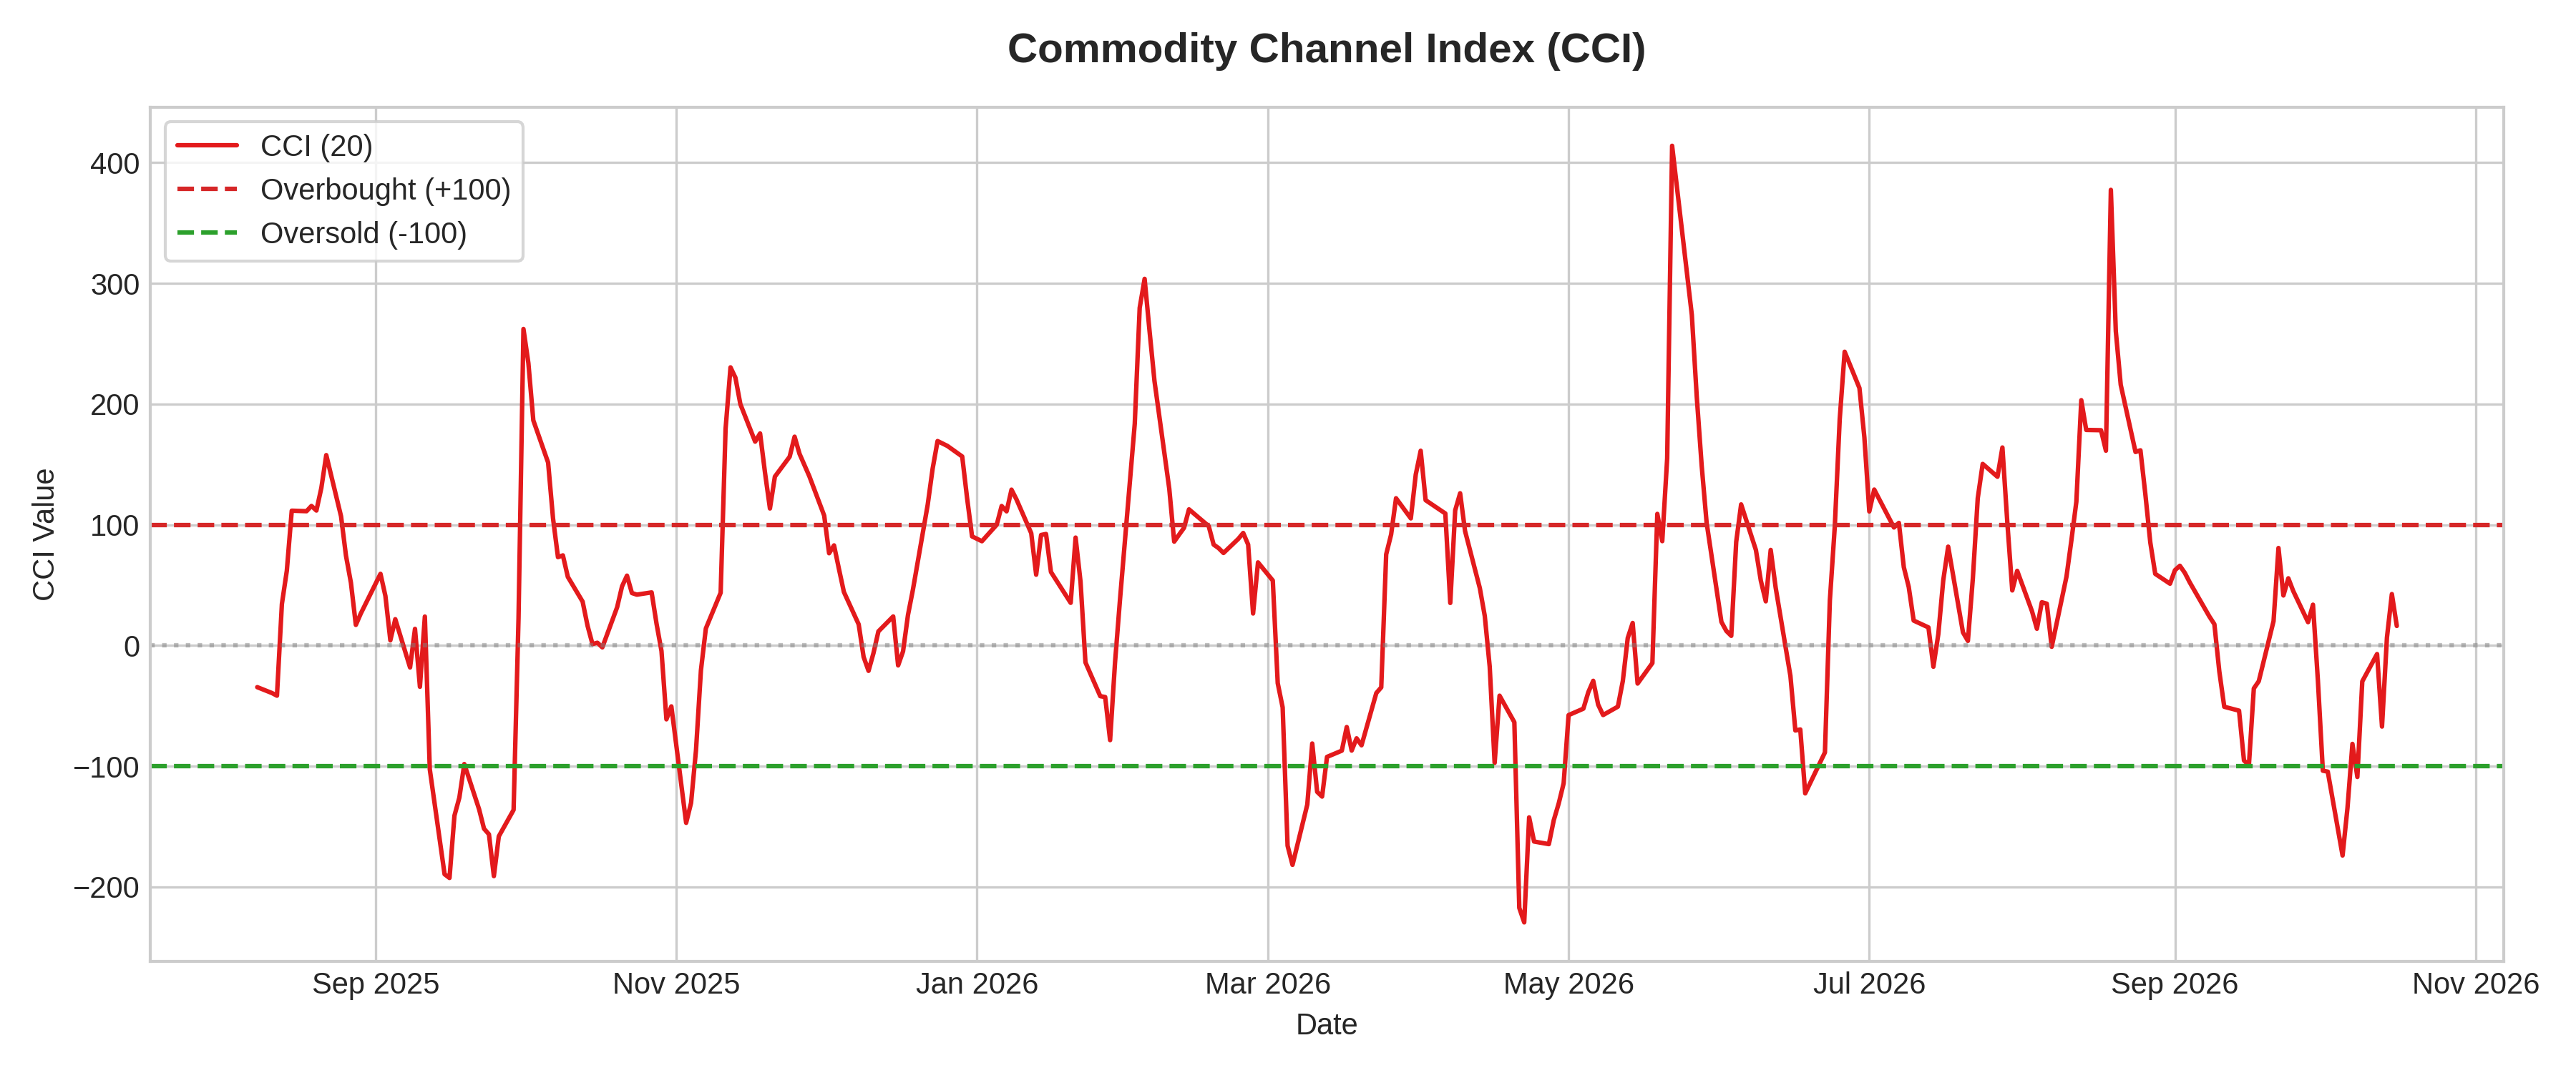
What it measures:
CCI measures the deviation of an asset's price from its statistical mean average price over a designated period.
How to interpret it:
- Extreme Thresholds: CCI above +100 indicates overbought conditions or strong breakout trends; CCI below -100 indicates oversold conditions.
- Zone Exit Events: Re-entering the -100 to +100 bounds from extreme levels triggers mean-reversion trade setups.
Used for:
- Identifying cyclical tops/bottoms and strong breakout regimes.
Limitations:
- Unbounded oscillator nature can lead to prolonged extreme readings during strong trends.