
Moving Average Convergence Divergence (MACD)
What is it?
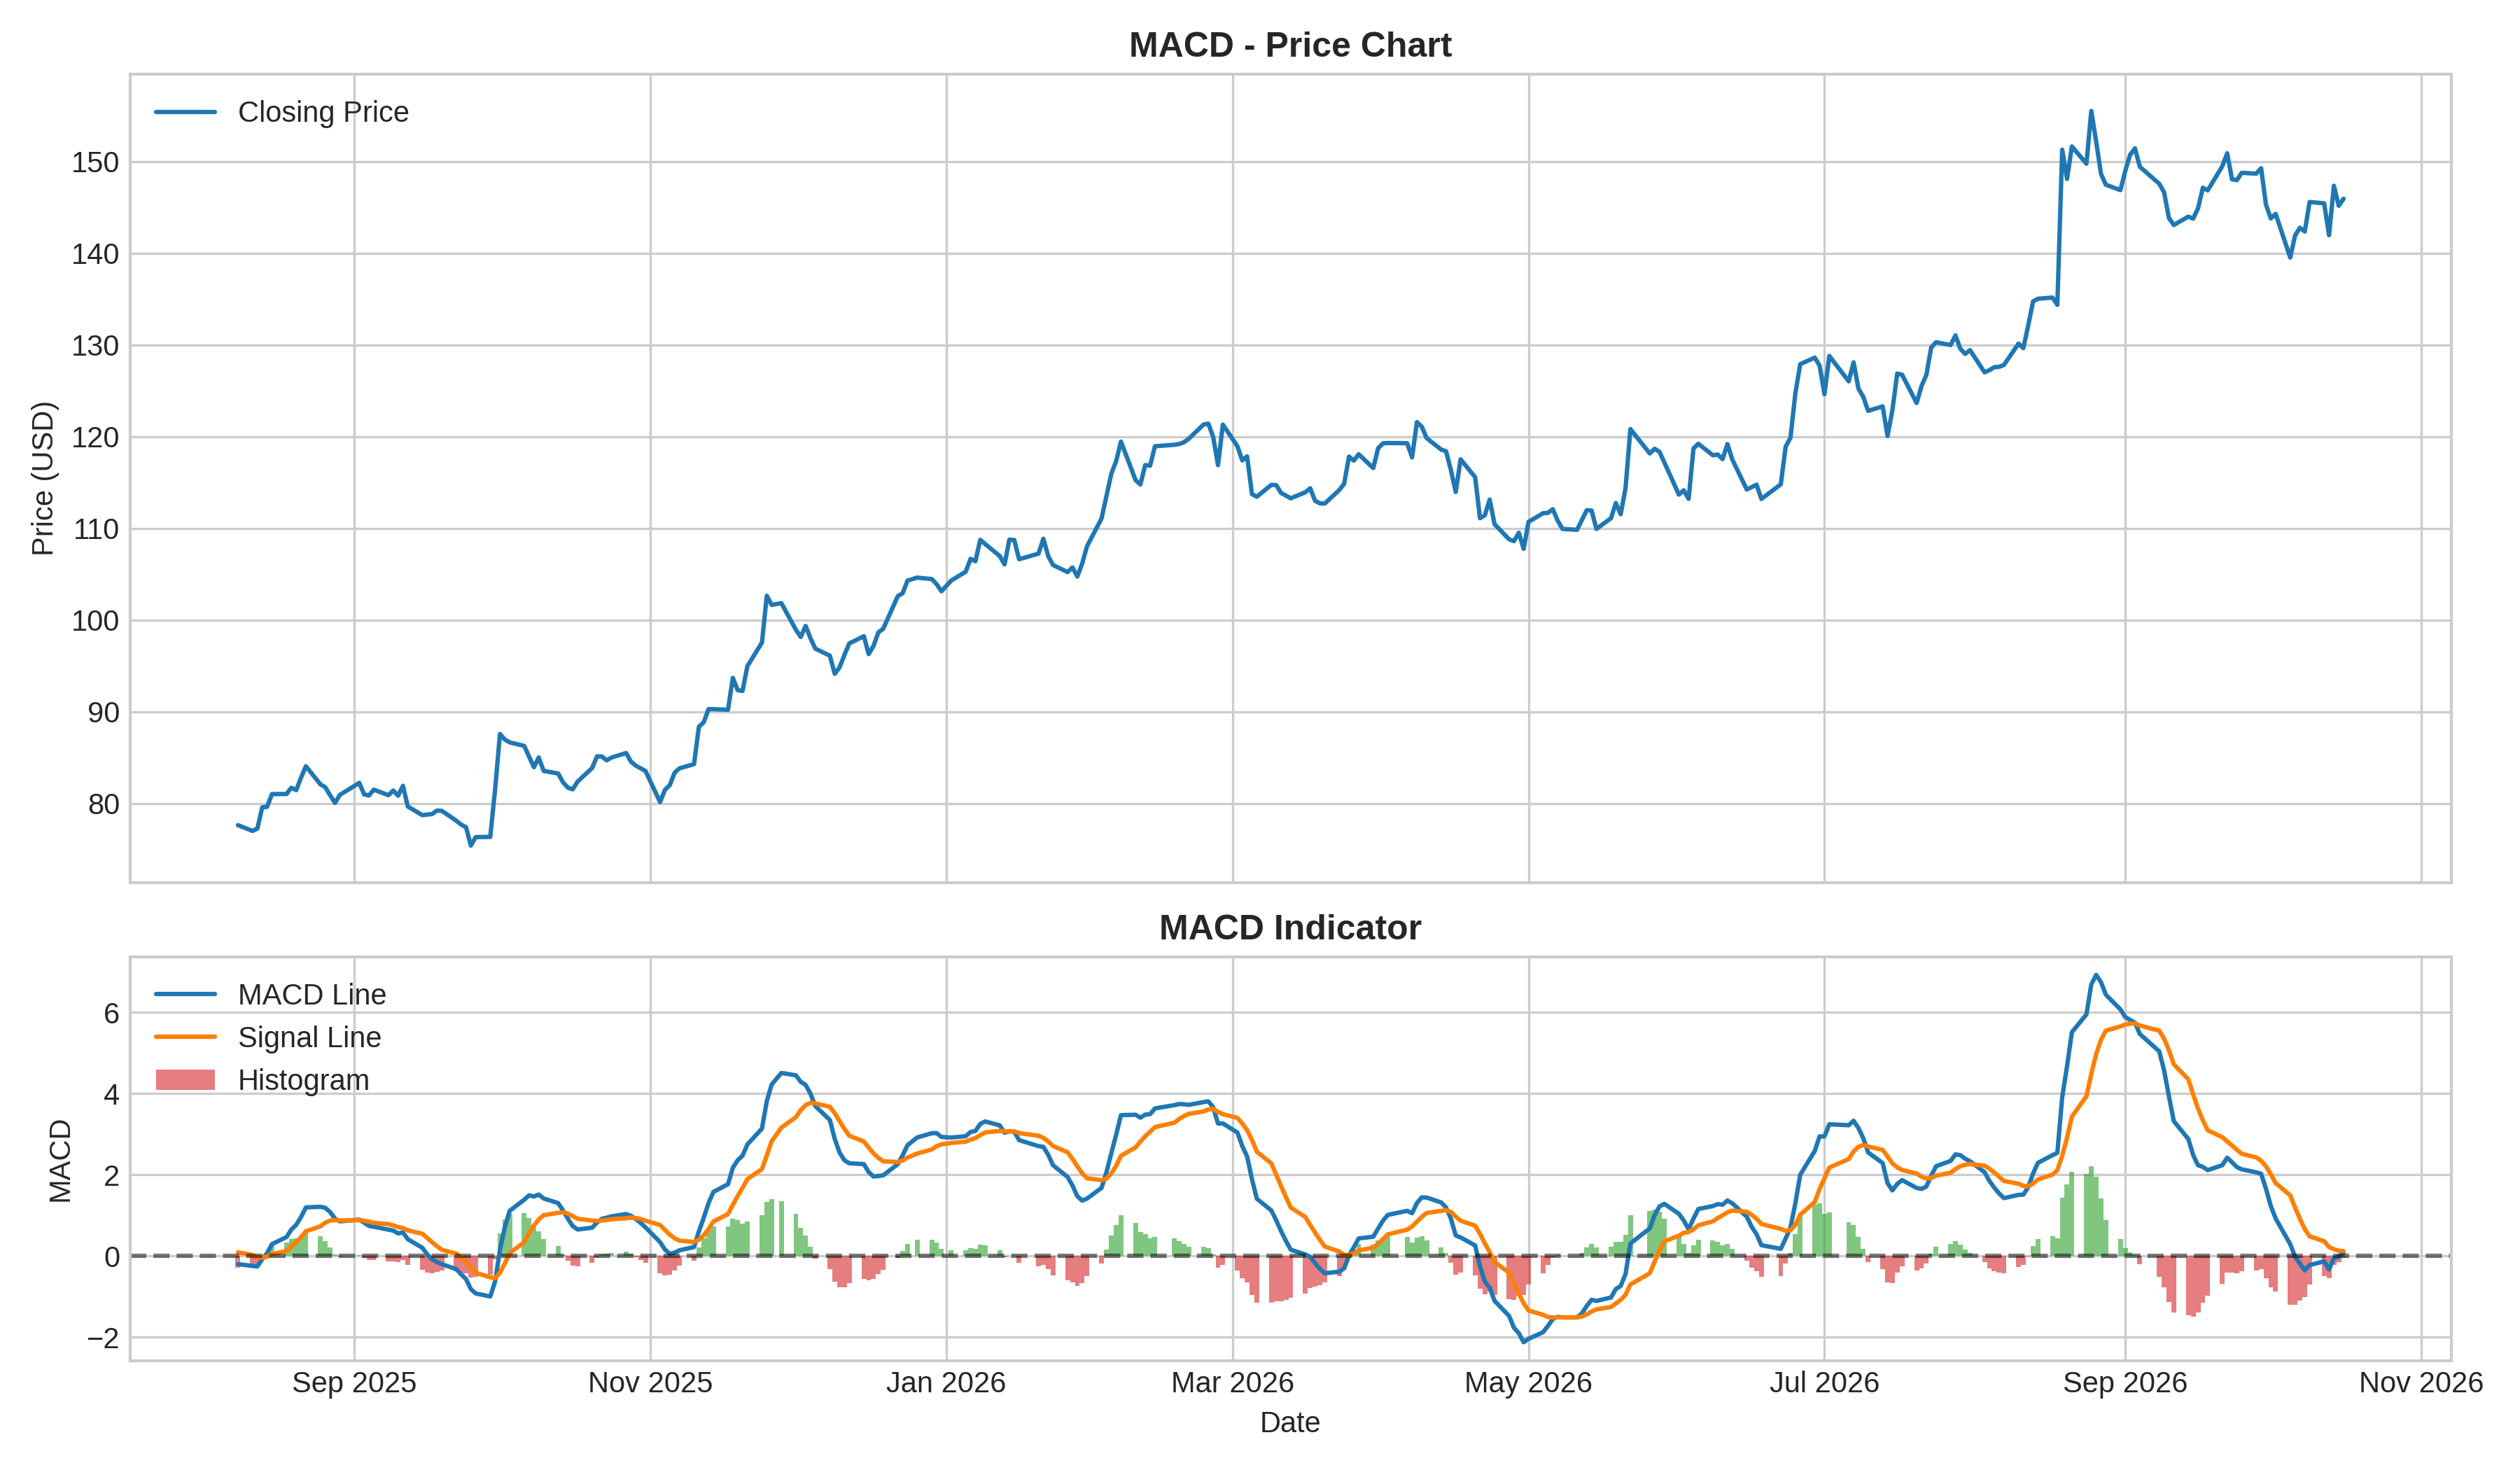
What it measures:
MACD measures trend direction and momentum by calculating the relationship between two EMAs (typically 12 EMA and 26 EMA), along with a 9-period Signal line and Histogram.
How to interpret it:
- Signal Line Crossovers: MACD Line crossing above the Signal Line triggers a bullish buy signal; crossing below triggers a bearish sell signal.
- Zero-Line Crossovers: MACD above zero confirms sustained bullish trend momentum.
- Divergence: Bullish/Bearish divergence between MACD Histogram and price highlights slowing trend momentum prior to reversals.
Used for:
- Spotting trend direction changes and momentum shifts.
- Timing market entries and identifying trend divergence setup.
Limitations:
- Lagging nature means signals develop after price trend moves are already underway.
- Can produce multiple unprofitable crossovers in low-volatility sideways markets.